I am happy to announce our second Instructable project. Like the first one, it was a long-standing idea that was rolling in my mind for a long time. The current limited travelling mobility due to the COVID offered more time to develop this idea during my vacation. In a joyful collaboration with my son Leonardo, we managed to realize this useful device in a very short time.
This project aimed to develop a device that integrated with a cheap USB microscope allows taking 3D pictures of small samples. The project is meant to be an education STEM activity to learn using Arduino, 3D image reconstruction, and 3D printing by creating a useful piece of equipment for doing some exciting science activity. Like my previous project, it is also a moment to share good and educative time with my family and in particular, my elder son Leonardo that helped me in creating this instructable and evaluating the device as an enthusiastic STEM student. This time, also my lovely wife helps me to make a video of the assembly of the equipment!
The roto-microscope allows controlling the position of a simple USB microscope around the sample. This allows to take accurate pictures from different angles and not just from the top as in the traditional microscopes. This is not a new idea as there are professional microscopes. However, this device means to be affordable for a student and still provides some similar results and a lot of fun in building it. Other similar and excellent OpenSource projects are available (see, for example, the Ladybug microscope, the Lego microscope, and the OpenScan project), our project adds an additional option and I hope that you enjoy making it as we did!
If you find it an interesting device then instructions on how to build it are on our Instructable.


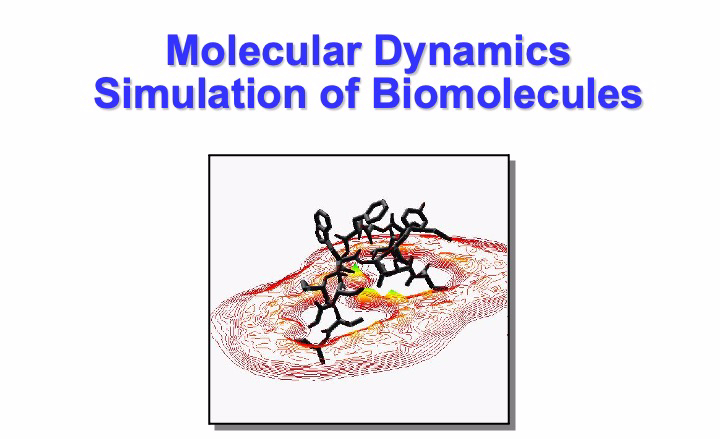
 , where N is the total number of electrons in the system. It was clear that a reduction, using ad hoc approximations, of the description of the dynamic behaviour of atoms using a classic physics model would be necessary to overcome this problem. In the classical representation, the electrons on the atoms are not explicitly considered, but their mean-field effect is taken into account. Alder and Wainwright performed the first simulation of an atomic fluid using this approximation approximately 63 years ago (1957). They developed and used the method to study simple fluids by means of a model representing atoms as discs and rigid spheres. These first pioneer studies mark the birth of the classical molecular dynamics (MD) simulation technique. The successive use of more realistic interaction potentials has allowed obtaining simulations comparable to experimental data, showing that MD can be a valuable tool for surveying the microscopical properties of physical systems. The first simulations of this type were carried out by Rahman and Verlet (1964): in these simulations, a Lennard-Jones-type potential was used to describe the atomic interactions of argon in the liquid state. Another significant hallmark in this field was the simulation of the first protein (the bovine pancreatic trypsin inhibitor) by McCammon and Karplus in 1977. In the following years, the success obtained in reproducing structural properties of proteins and other macromolecules led to a great spread of the MD within structural biology studies. The continuous increase of computer power and improvement of programming languages has concurred with further refinement of the technique. Its application was progressively expanded to more complex biological systems comprising large protein complexes in a membrane environment. In this way, MD is becoming a powerful and flexible tool with applications in disparate fields, from structural biology to material science.


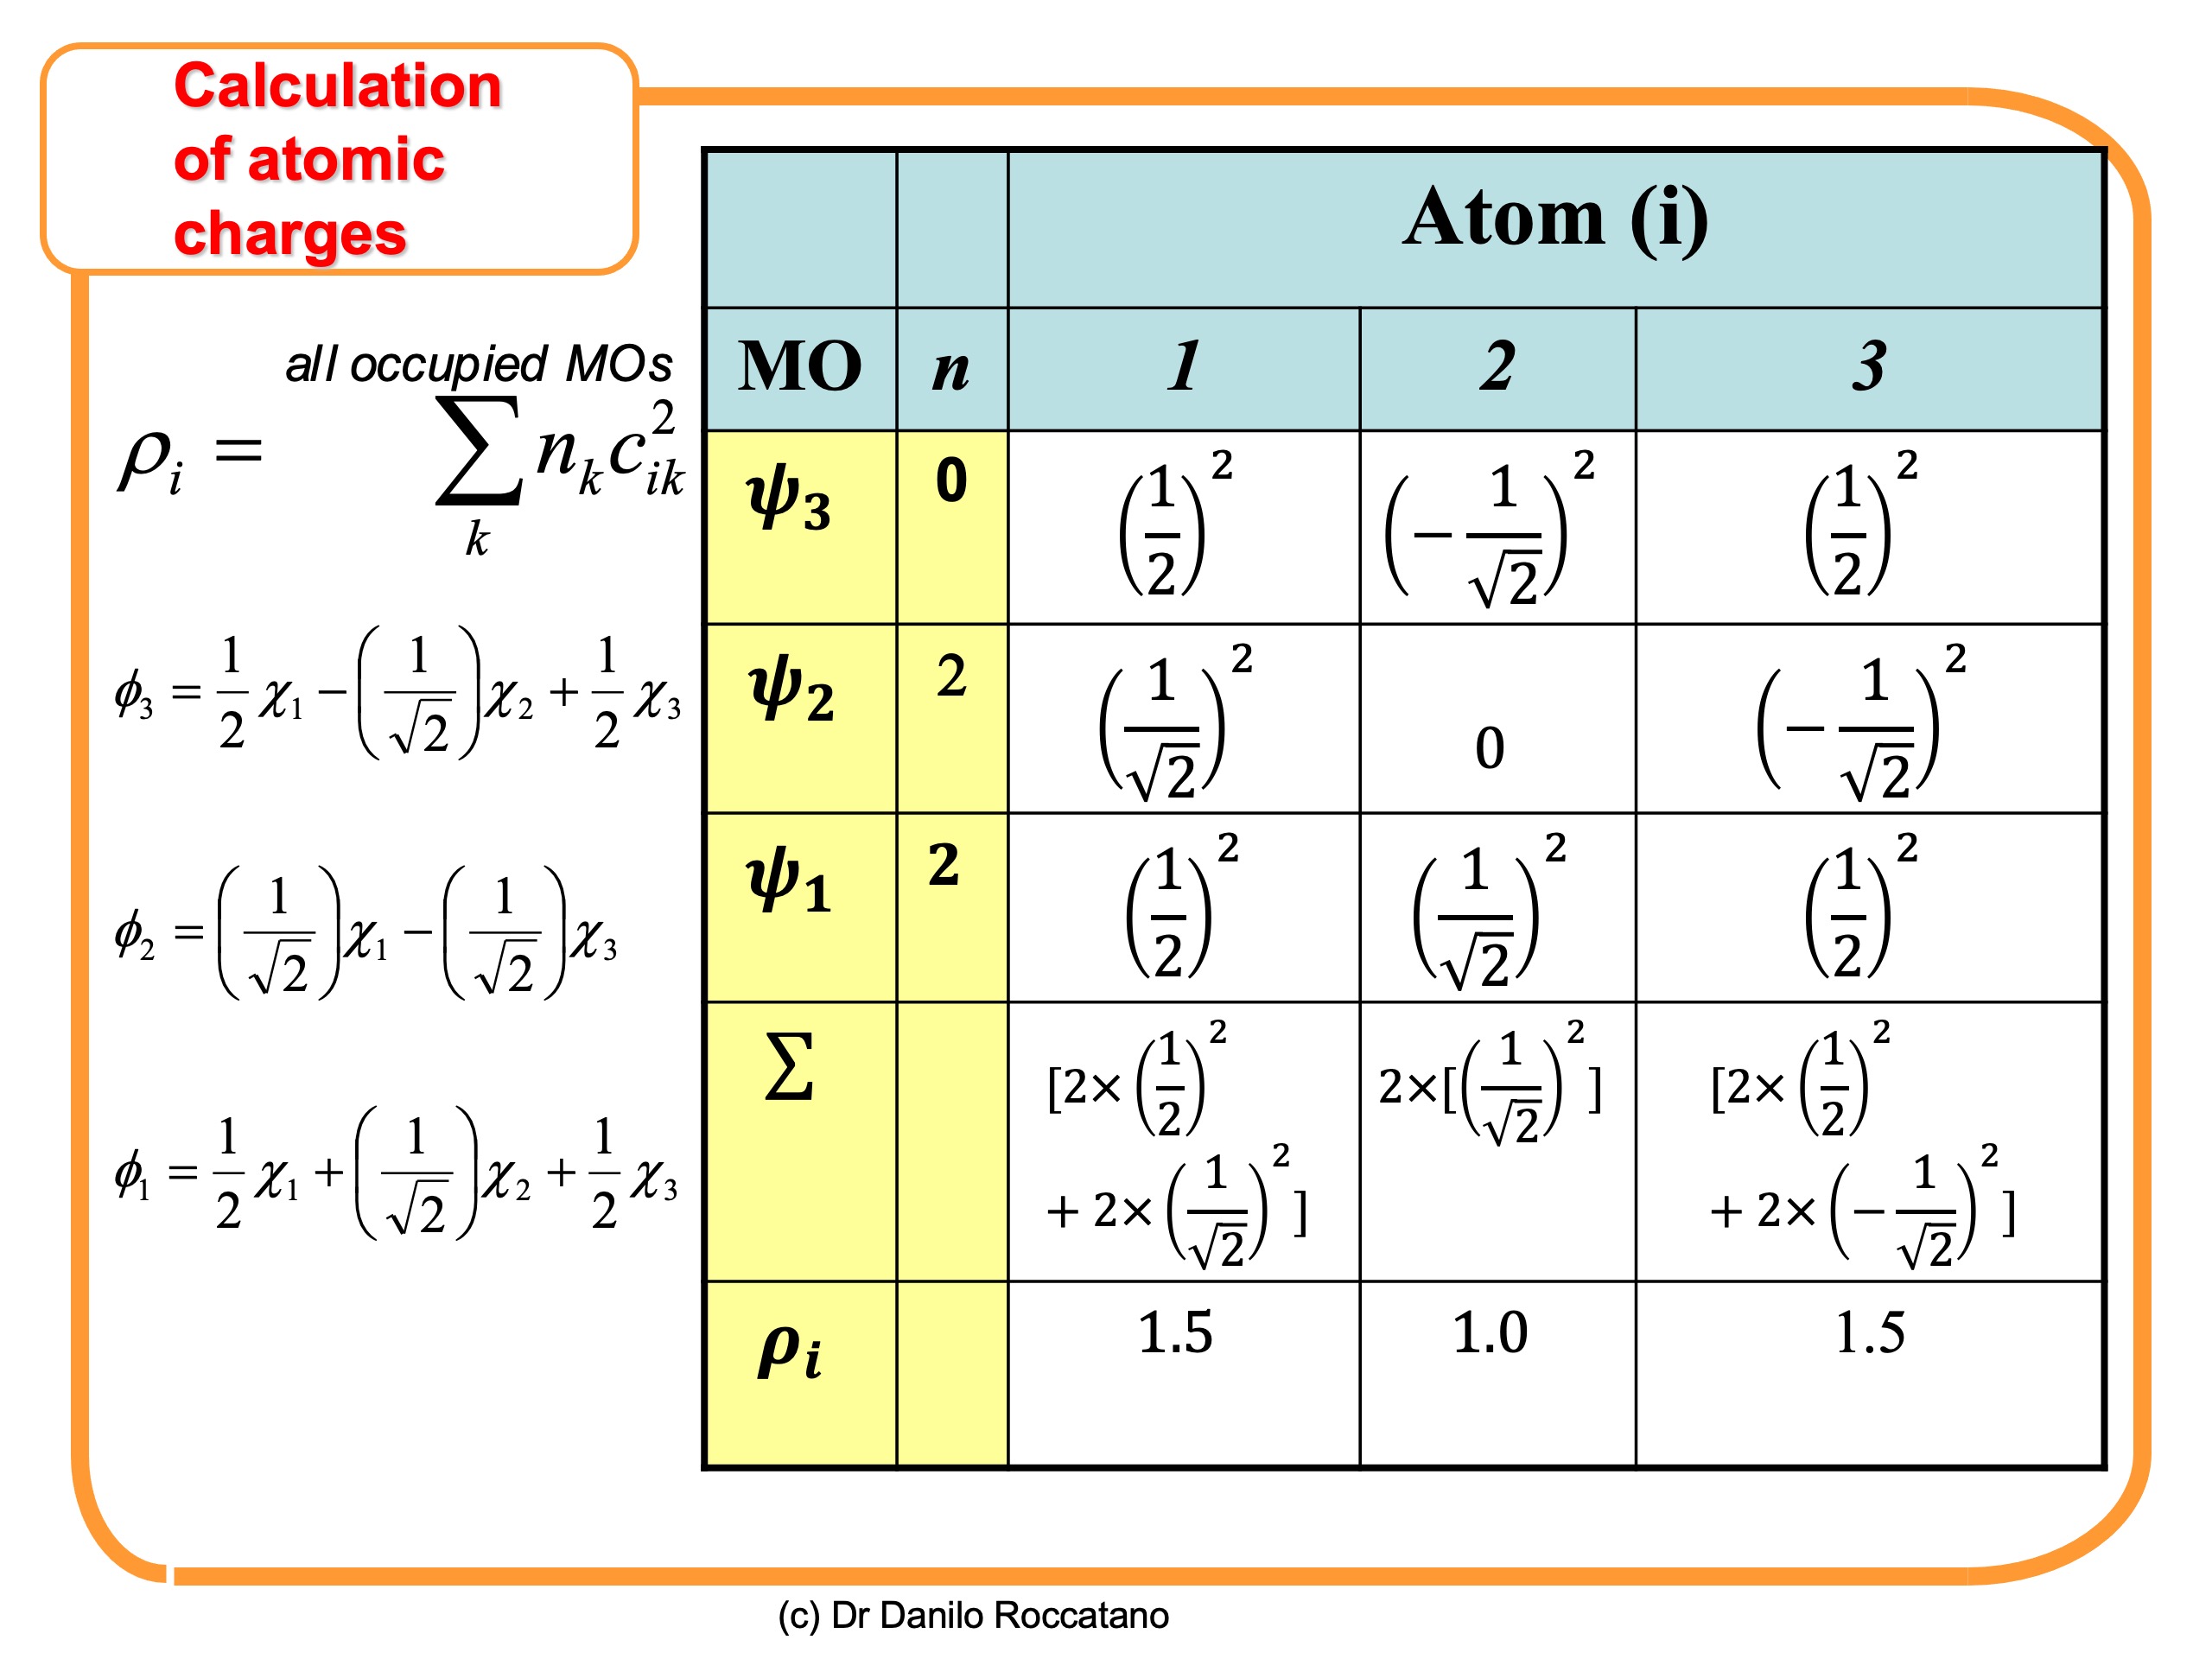
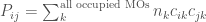
 (1)
(1) is the number of electrons in the
  orbital.
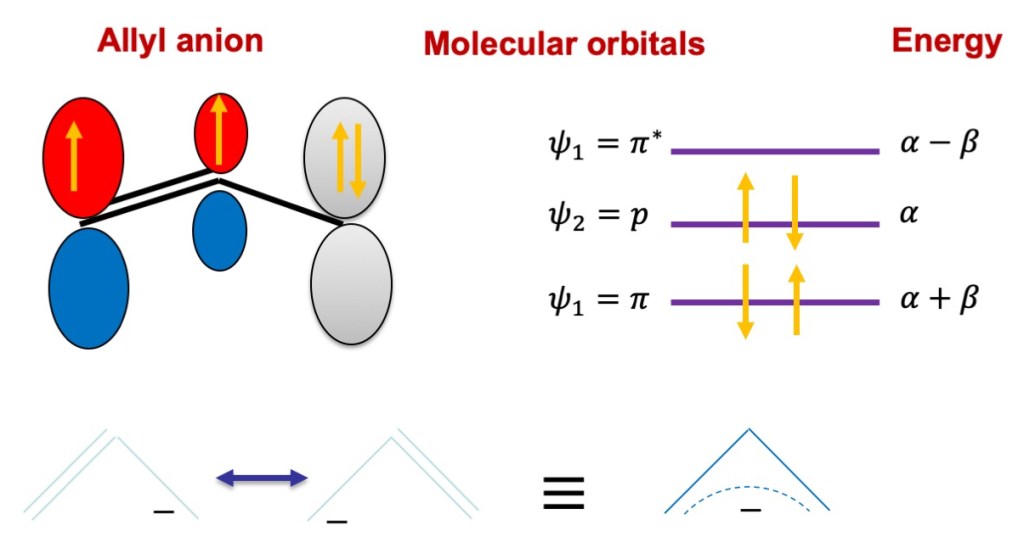
 of the allyl radical is reported. The result shows an equal contribution of 0.707 for both bonds.
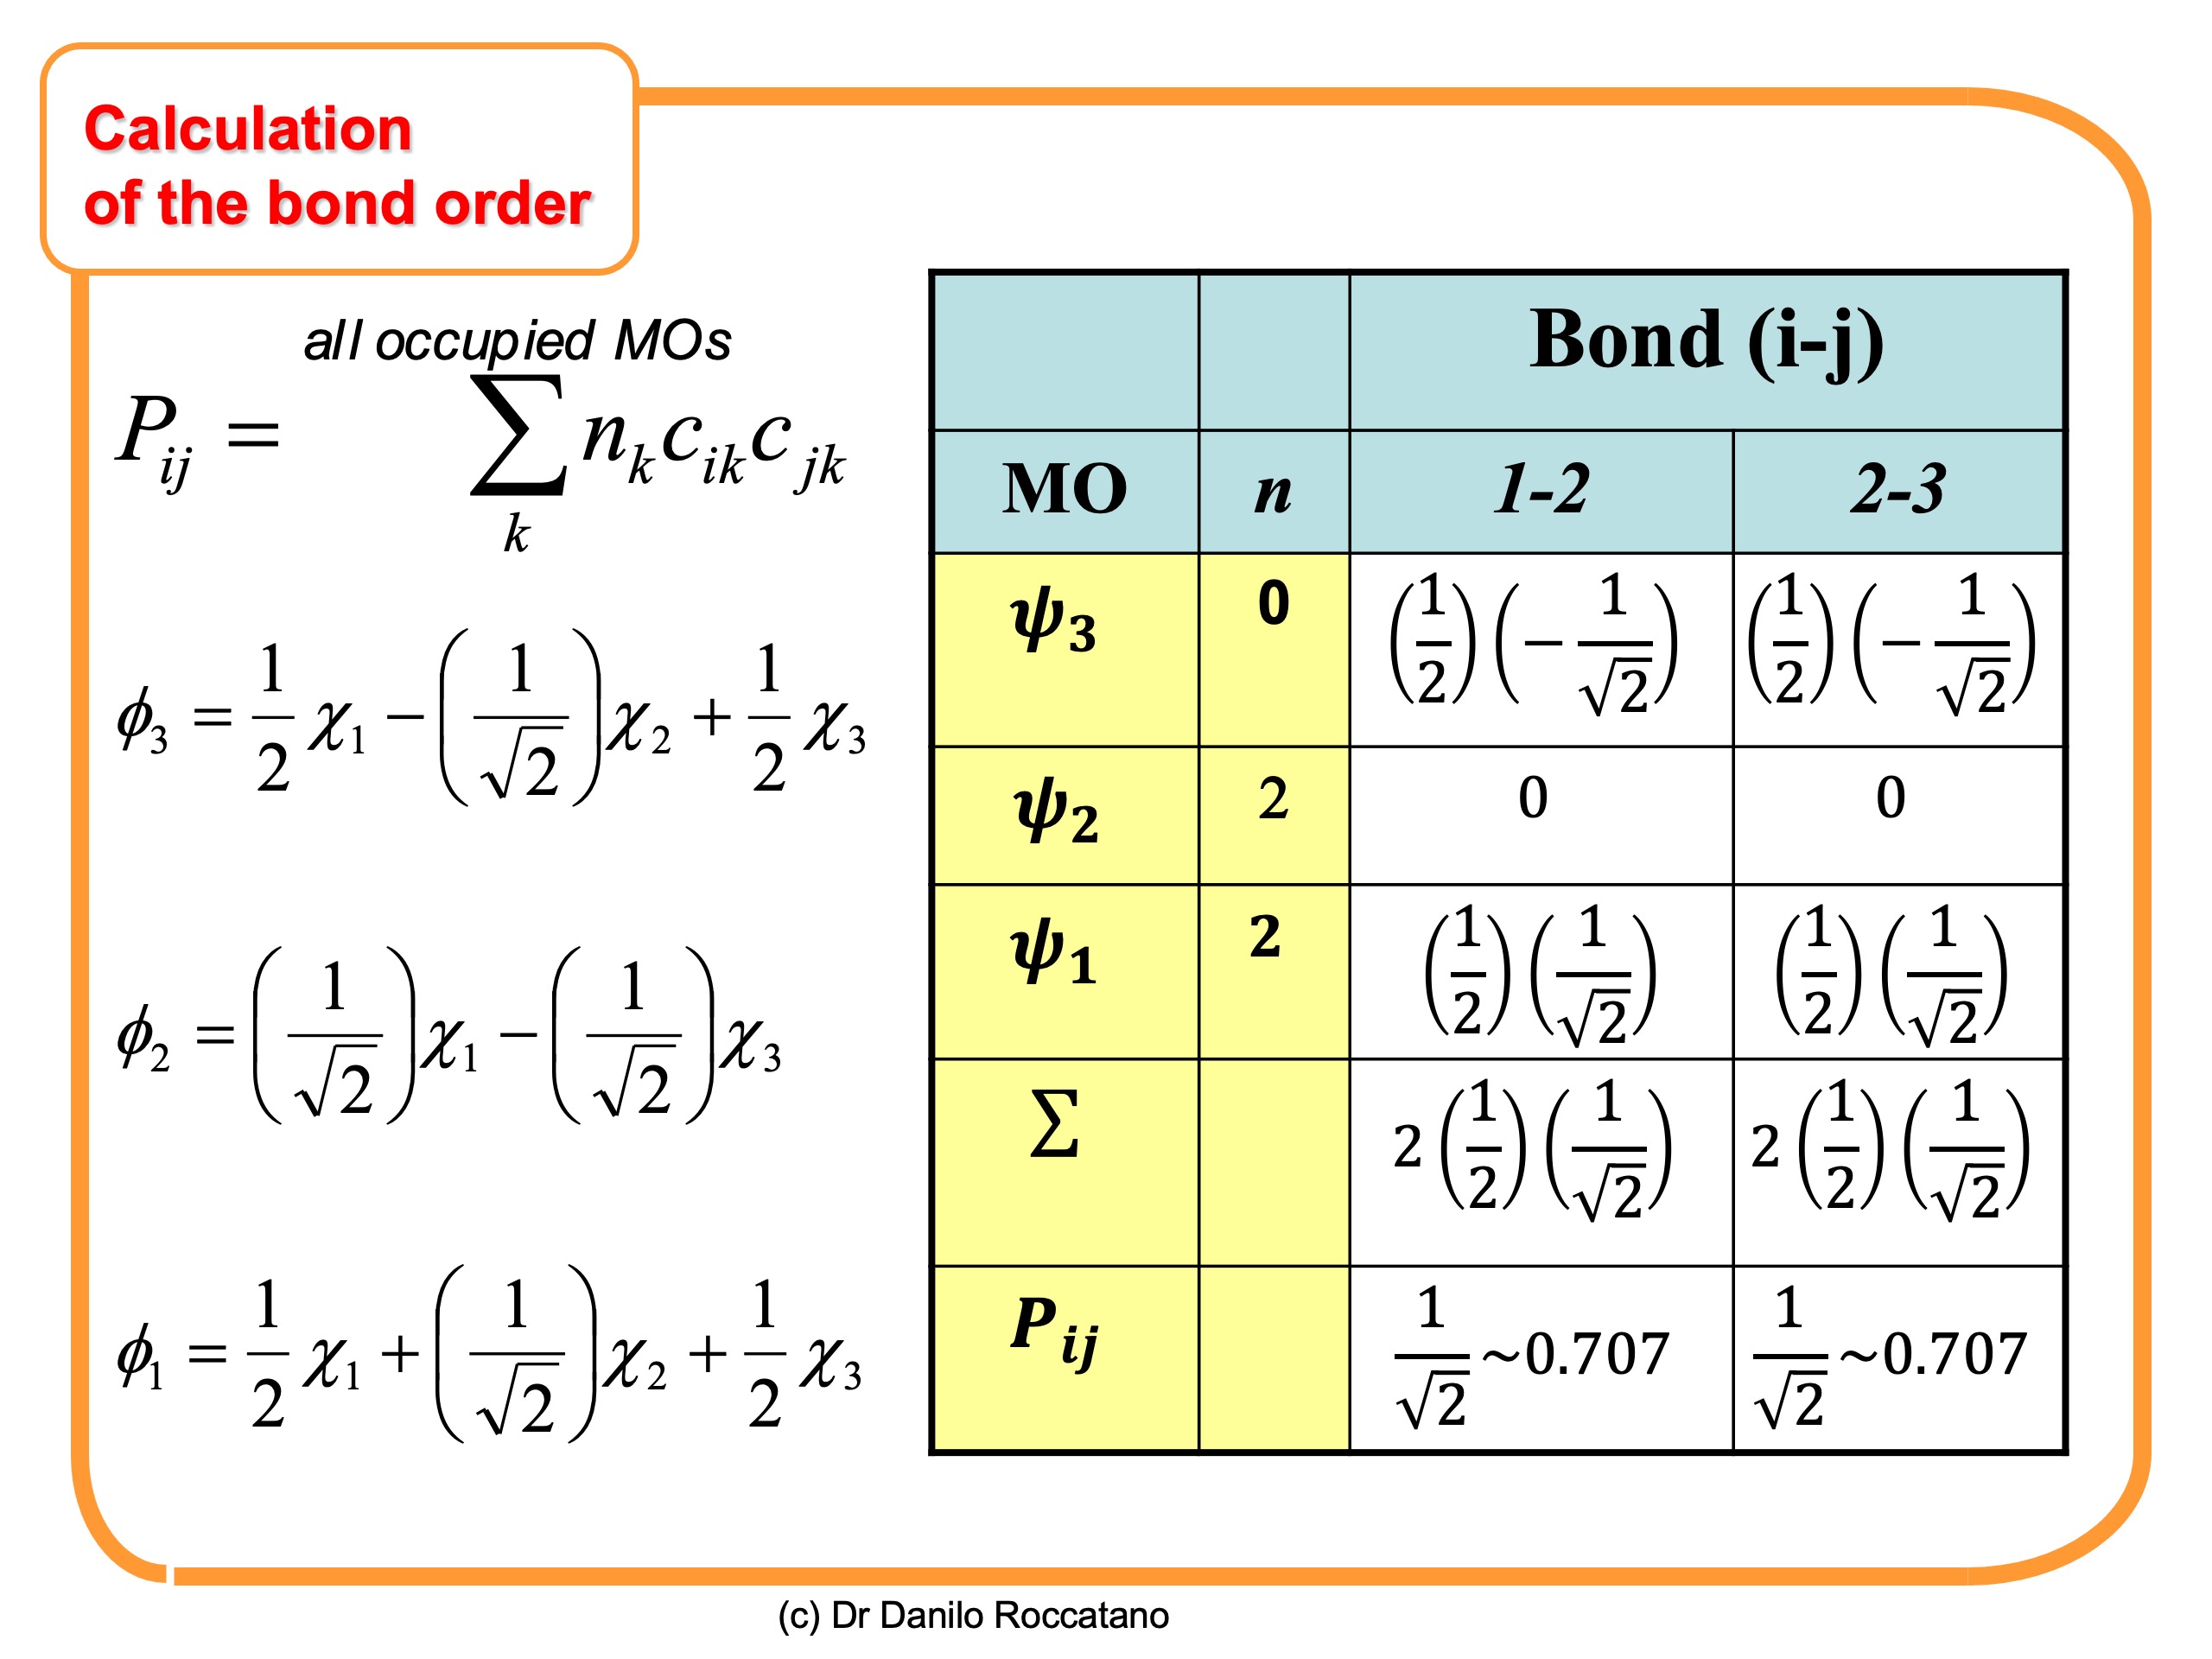
 as shown in the examples reported in the figure below.

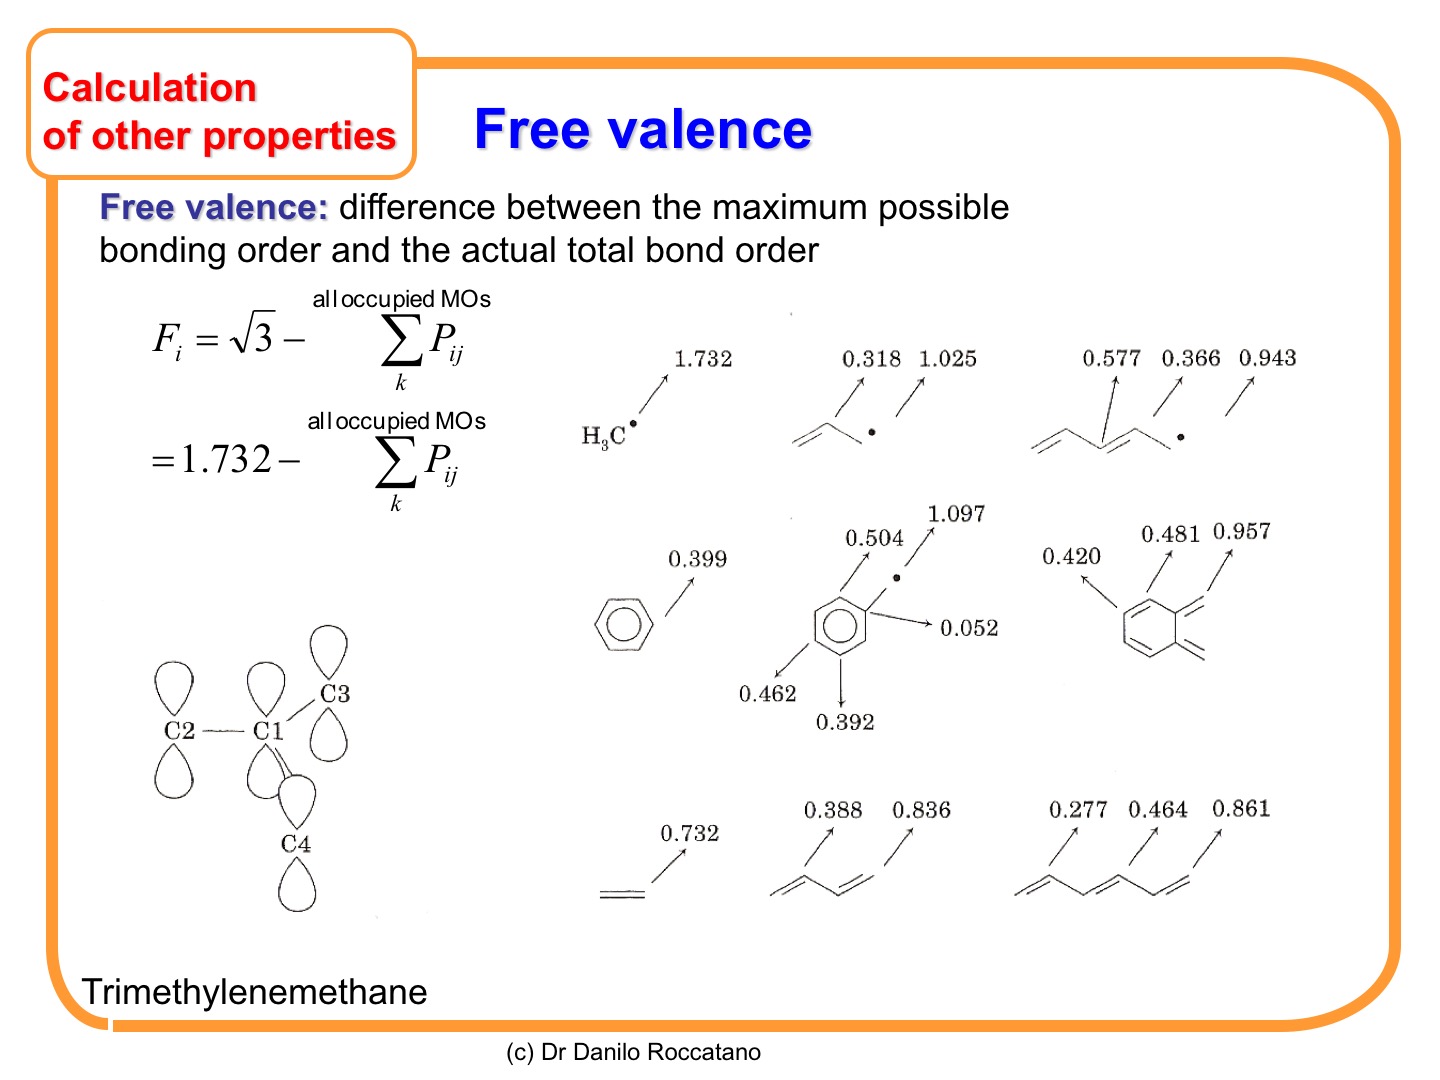

 -bonds. In this third article, we will apply the method to cyclic molecules and will derive some other useful properties.


