Solar Eclipse 12 August 2026 from Lincoln, UK | Telescope, Environmental Data & JPL Simulation

Just a few days ago, I was lucky enough to witness, with my own eyes (safely protected by a proper solar filter!), one of the most fascinating astronomical events visible from Earth: a solar eclipse. Eclipses are not particularly rare on a global scale, but their visibility strongly depends on geographical location. The path of a total solar eclipse covers only a relatively narrow region of the Earth’s surface, meaning that totality may return to the same location only after a very long interval. Solar eclipses have fascinated humans for thousands of years and are among the astronomical phenomena most extensively recorded by ancient civilizations. Historical observations from Babylon, China, Europe, and the Arab world are so valuable that they have even been used to investigate changes in the Earth’s rotation over the past several thousand years.

On 12 August 2026, a total solar eclipse crossed parts of the Northern Hemisphere. From the UK, where I currently live, totality was not visible, but a substantial partial eclipse could still be observed. Having a basic refractor telescope and a good observation point, I decided to try recording the entire event as a time-lapse. I invested in a suitable solar filter for my Bresser Arcturus 60/700 mm telescope. The telescope has no automatic tracking, so this meant manually following the Sun throughout the roughly two-hour event. Afterwards, I planned to use Python, computer vision, and ChatGPT to align and filter the recorded frames and reconstruct a smooth eclipse sequence.

But my interest in this event was not limited to photographic observation. I was also curious to extract quantitative information from the recorded frames and to investigate what was happening to the environment while the Moon progressively obscured the Sun. Changes in incoming solar radiation should affect quantities such as light intensity, UV radiation, and, potentially, temperature and humidity. I already had several Arduino boards and a collection of inexpensive sensors at home, so this seemed like a perfect opportunity to turn the eclipse observation into a broader experiment. The question behind the project therefore became: Could a simple telescope, a few low-cost sensors, and some Python code reveal not only the progress of a solar eclipse, but also how the environment responds to it? The answer was YES: it is possible, and it was pretty simple to set it up!

I have published an article on my Instructables website in which I outline the setup of my Environmental Solar Station (ESS), show what I measured during the eclipse, and suggest ideas for future development. In this post, I will instead give some information about the creation of the video on the YouTube channel embedded below.

The Observation

As mentioned in the introduction, I used a simple beginner-level refractor telescope to capture the eclipse photo.  I bought a suitable solar filter compatible with the 60mm tube and attached a smartphone adapter to an old iPhone 6. This adapter connected to the telescope’s 20mm (lowest magnification) objective.  For the best vantage point and longest observation time, I positioned the telescope on the upper floor of my house in front of a south-oriented window.The location provided a convenient spot to mount the ESS on the roof outside the window.  This allowed me to connect it to my laptop at a comfortable distance using a long USB cable.

For the image collection, I used Lapse It, a well-made time-lapse app that I had already used for a previous small project. Unfortunately, due to a moment of distraction, I recorded the entire sequence at the lowest resolution available: 640 × 480 pixels. Alas, sbagliando s’impara (“you learn from your mistakes”), as an Italian saying goes! Fortunately, this turned out not to be a major problem for the subsequent analysis. The resolution was sufficient to follow the progression of the eclipse and determine the relative positions of the Sun and Moon. Nevertheless, recording at a higher resolution would certainly have produced much better images and, in particular, might have allowed details such as sunspots to be resolved more clearly. As the Earth rotates, the Sun’s image doesn’t stay centred in the telescope.  Advanced telescopes have automatic tracking systems to keep the telescope pointed at the object, but I had to manually adjust the orientation to prevent the Sun from disappearing from view. I continued this until around 19:40 when the Sun’s position in the sky was setting too low and a branch of a tree in front of the house blocked its view.

Nevertheless, I had plenty of frames, and the resulting video showed the sun and moon moving around during the video and sometimes partially out of view. I needed to select frames with the sun/moon system in view and center the sun to follow the moon’s motion on the solar disc. An excellent problem that can be solved using computer vision. I used the assistance of ChatGPT. This helped me with code writing and debugging, reducing the time needed to obtain the different Python programs needed for the preparation of the video that I had in mind. The Python programme automatically identifies the good frames from the cut ones and also centres the sun’s circle in the image. This provided a sufficient number of frames. Still, there was some problem matching the data with the partial recording of the eclipse. Therefore, the missing frames at the end of the movie have been generated taking into account the predicted values from the Jet Propulsion Laboratory ephemerides of the Sun and Moon in the sky.

Fortunately, the ESS data logging functioned perfectly. It continued throughout the event until approximately 20:10. The image collection was repeated every 5 s for a total of 1400 frames, while the data was logged every second. The data logged several parameters, but the most relevant was the one from the phoresistor module, the UV sensor, and the temperature, that have been used to monitor the environmental changes occurring during the eclipse. These data have been synchronized with the video recording in the form of graphs and numerical data. This allowed us to quantitatively monitor the effect of the different phases of the eclipse on these environmental variables.

In preparing the video for my YouTube channel, I wanted to add a musical background that could evoke some of the emotion associated with such a remarkable celestial event. Since the time of Pythagoras, music has been associated with the ordered movements of the heavens through the ancient idea of the music of the spheres. Classical music therefore seemed a particularly appropriate companion to the astronomical simulation and to the images recorded during the eclipse. A solar eclipse is, in a sense, an entrance into darkness—but a darkness quite different from night. It is the shadow cast by our celestial companion, the Moon, temporarily interrupting the light of the Sun. The shadow advances, the landscape darkens, and then the light gradually re-emerges. For the Eclipse 2026 video, I wanted the music to reproduce something of this progression: the approach of the shadow, the moment of maximum obscuration, and finally the return of the light. The extraordinary transition from the third to the fourth movement of Ludwig van Beethoven’s Symphony No. 5 in C minor, Op. 67 seemed particularly fitting. Near the end of the third movement, the music becomes mysterious and expectant, almost suspended in darkness. Then, without interruption, it bursts into the triumphant C-major opening of the fourth movement. Darkness gives way to light. This musical progression seemed remarkably well suited to the sequence shown in the video of the partial solar eclipse observed from Lincoln on 12 August 2026, where the astronomical simulation was synchronized with the recorded images and the environmental observations made during the event.

The next challenge was to find a historical recording of Beethoven’s masterpiece that I could use for the soundtrack. Searching through the collections of the Internet Archive, I discovered a remarkable recording made on 14 November 1940 at New York’s renowned Liederkranz Hall, with Beethoven’s Fifth performed by the All-American Youth Orchestra, the remarkable ensemble of young musicians founded by Stokowski that same year, under the direction of the legendary conductor himself—who, also in 1940, famously collaborated with Walt Disney on Fantasia. The recording was originally made for Columbia and subsequently issued in 1941 as part of the Columbia Masterworks series on 78-rpm records. Particularly convenient for my project, the archived version presents the third and fourth movements together in a single audio file, preserving Beethoven’s uninterrupted transition from the Scherzo into the Finale.

You can enjoy the complete video using the embedded link below. I hope you enjoy watching it as much as I enjoyed putting this project together.

If you like it, please consider liking the blog post and the YouTube video—and feel free to share it with anyone who might enjoy this journey through astronomy, nature, and music!

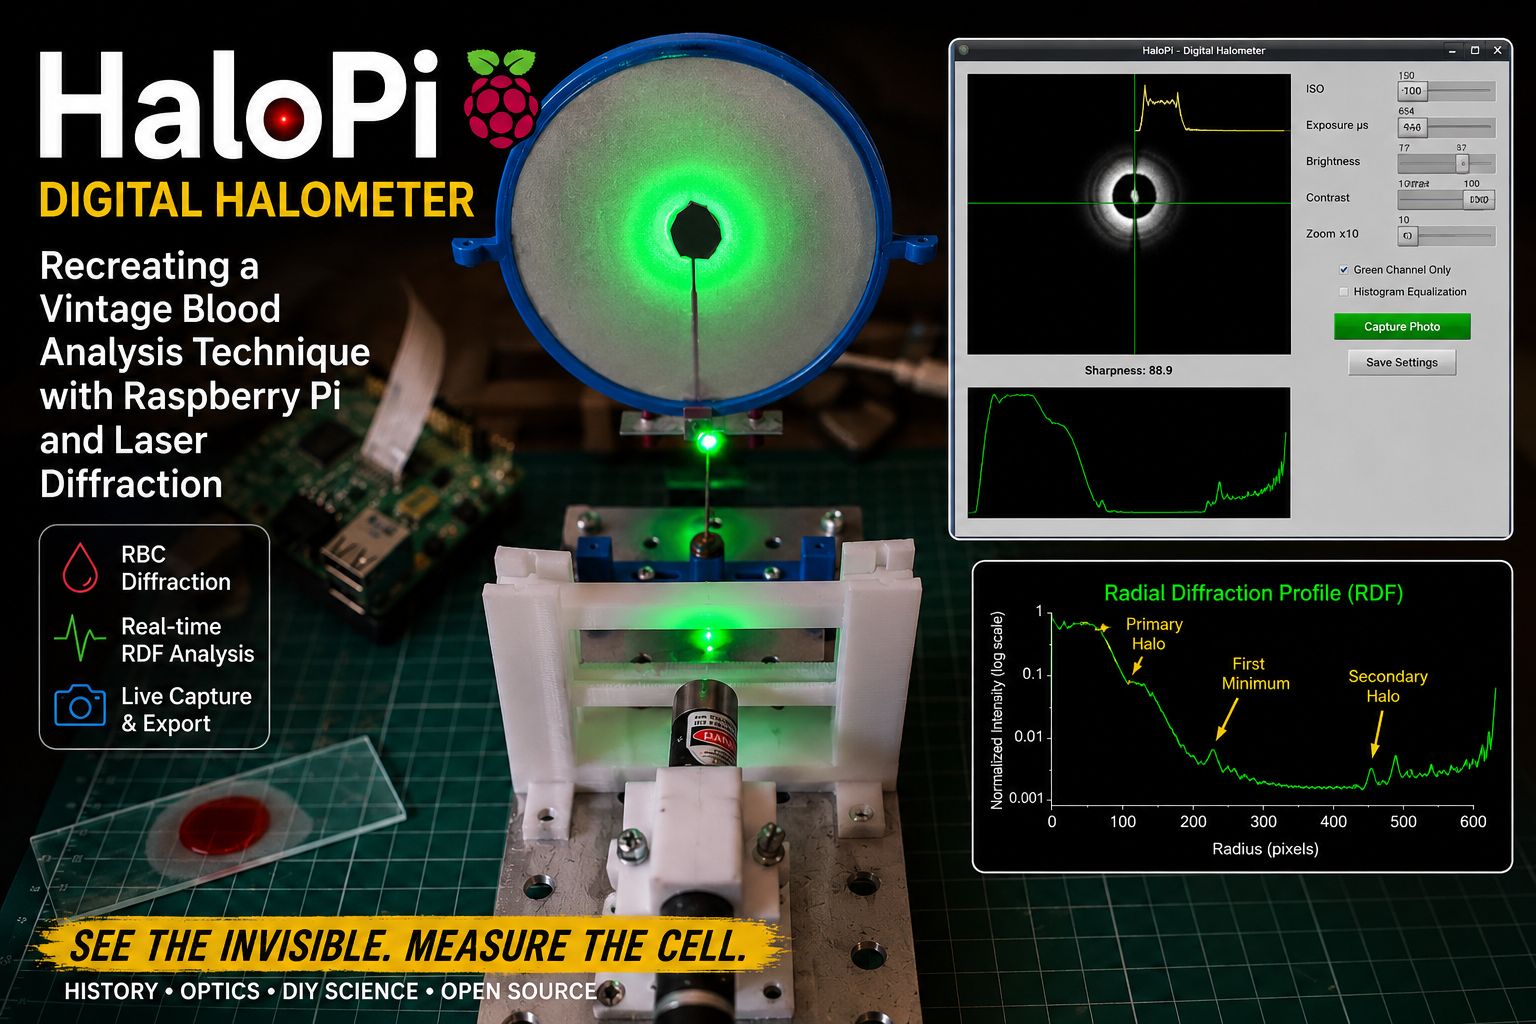
Rediscovering Halometry with Raspberry Pi and Laser Diffraction

One of the aspects of experimental science that I find most fascinating is the rediscovery of historical scientific instruments and techniques that have gradually disappeared from modern laboratories. In my latest Instructable project, I explored the reconstruction of a remarkable optical device once used in hematology during the early twentieth century: the halometer.

Before the advent of automated blood analyzers and digital microscopy, researchers investigated ingenious indirect methods for estimating the average size of red blood cells. One of these methods relied on diffraction phenomena produced when coherent light passed through thin blood smears. The resulting circular halos could be related to the average diameter of erythrocytes, providing a rapid—although approximate—diagnostic technique for conditions such as pernicious anemia.

Continue reading

Ettore Majorana e L’Equazione di Fermi-Thomas

Perché al mondo vi sono varie categorie di scienziati, gente di secondo e terzo rango, che fa del suo meglio ma non va lontano; c’è anche gente di primo rango, che arriva a scoperte di grande importanza, fondamentali per lo sviluppo della scienza. Ma poi ci sono i geni, come Galileo e Newton. Ebbene Ettore era uno di quelli. (Commento di Enrico Fermi alla notizia della scomparsa di Majorana)

Qualche tempo fa ho rivisto il film su Raiplay in due parti diretto da Gianni Amelio, I ragazzi di via Panisperna. Si tratta di un’opera trasmessa dalla Rai alla fine degli anni Ottanta, molto bella e ben realizzata, che racconta le vicende che portarono alla formazione, negli anni Venti e Trenta, del celebre gruppo di Enrico Fermi presso l’Istituto di Fisica di via Panisperna, all’Università di Roma. Il film si concentra in particolare sulle figure di Ettore Majorana (interpretato da Andrea Prodan) e di Enrico Fermi (Ennio Fantastichini).

Continue reading

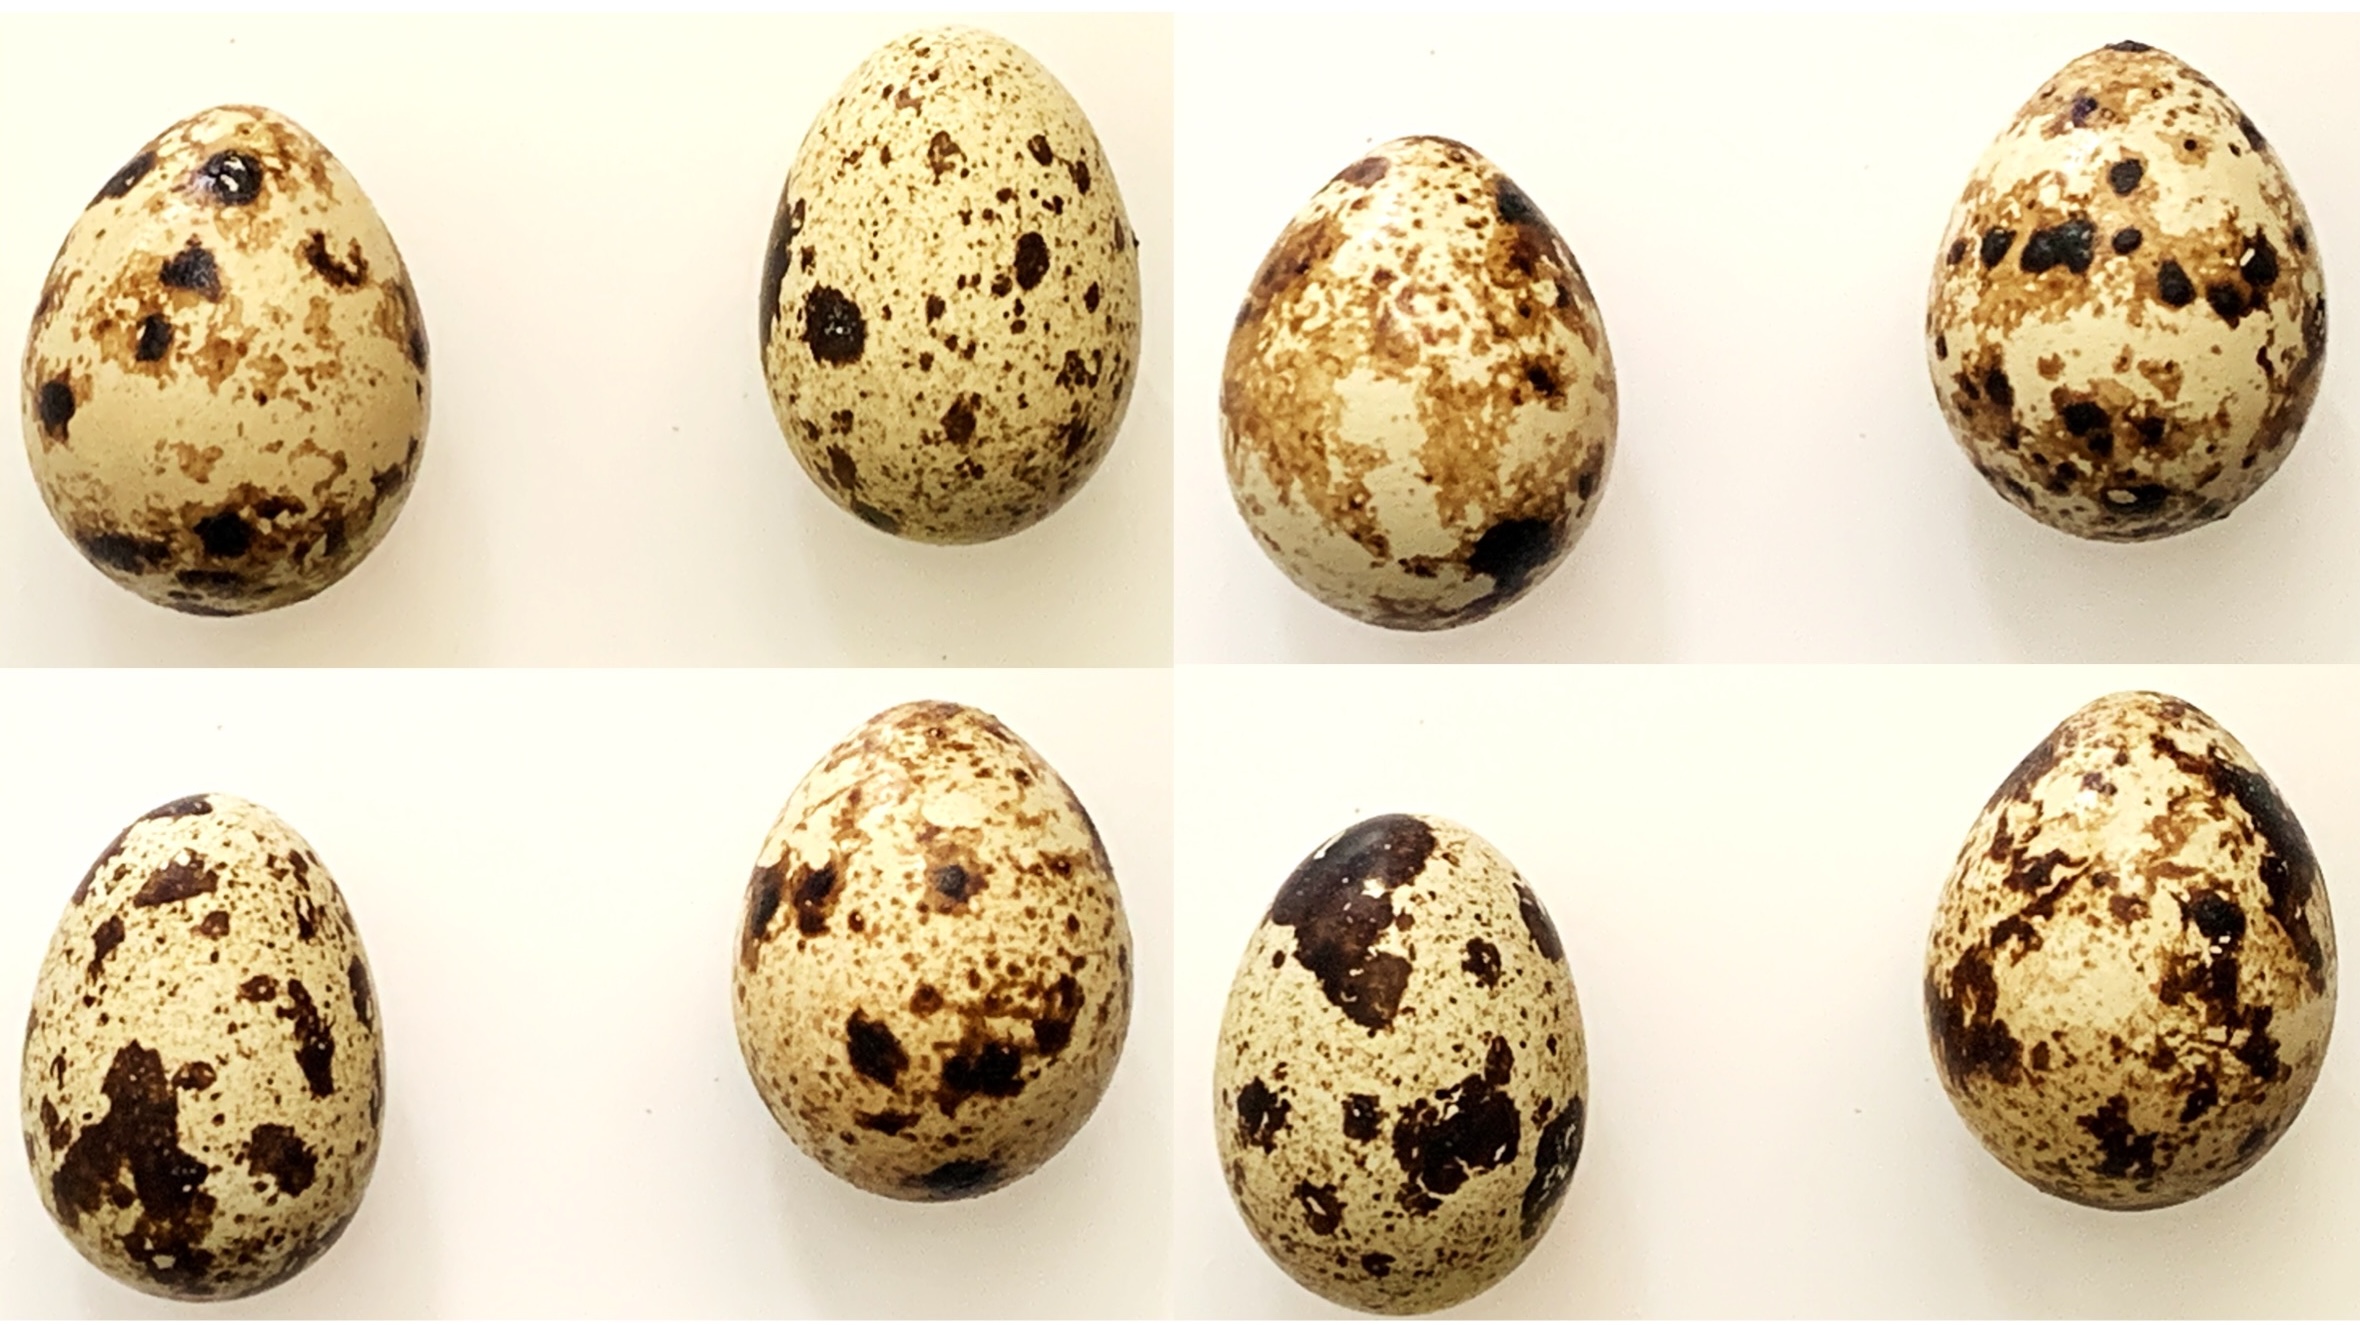
Easter 2026: The Patterns on Coturnix Egg

Last year, after a series of unsuccessful attempts and acquiring three incubators across two countries, my youngest son’s unwavering determination finally paid off.  From a batch of twelve mixed quail eggs, seven hatched successfully, marking the start of our new venture into farm animal husbandry.  Currently, we’ve settled for manageable pets like a Siberian hamster, an aquarium, and pond fish, plus several rounds of stick insects, mantises, and spiders, along with their grasshopper and locust food supplies.  However, quail care is more demanding. While our sons’ happiness is undoubtedly the most important reward, the delicious eggs produced by our farm breeding activity are equally rewarding for the whole family.  It’s particularly satisfying collecting every evening the two expected eggs from the punctual quail hens and admiring their different sizes and pigmentation like beautiful little gems.

If you’re still reading, you’ve probably guessed the main topics of my traditional Easter blog: quail eggs and their shapes and patterns.

Continue reading

Understanding the Discrete Fourier Transform in Signal Analysis

In previous posts on this blog I have already introduced the Fourier series and the Fourier transform, following their historical development from Joseph Fourier’s original work on heat conduction to their modern role in physics, engineering, and signal analysis. Rather than repeating that material here, I will take it as a starting point.

When we look at a signal — a sound wave, a vibration, or even a curve drawn by hand — we usually perceive it as a function of time or space. However, very often the most relevant information is not immediately visible in this representation. It is hidden in the frequencies that compose the signal, and in how strongly each of them contributes.

This is precisely the idea behind the Discrete Fourier Transform (DFT): to decompose a discrete signal into a finite sum of harmonic components, each characterized by an amplitude and a phase. Conceptually, the DFT is not a new theory, but a practical bridge between the continuous Fourier framework and the realities of digital data, measurements, and numerical simulations.

Rather than starting from abstract formulas, in this post I adopt a visual and experimental approach. The discussion is supported by an interactive program that allows one to draw an arbitrary signal and explore its harmonic content, and by a practical electronics project where Fourier analysis is applied to real sound and noise signals.

Continue reading

Retro Programming Nostalgia VIII: 1926-2026 l’equazione di Schrödinger e la struttura elettronica dell’atomo d’idrogeno

Quest’anno ricorre l’anniversario della pubblicazione dell’articolo di Edwin Schrödinger (1887-1961) in cui viene introdotta la sua famosa equazione. Prendendo spunto da questa occasione, ho ripescato e rinnovato uno dei miei antichi progetti di programmazione in BASIC con i miei microcomputer negli anni ’80. Di nuovo il microcomputer era il mio amato Phillips MSX, di cui ho parlato in altri blog. Studiando chimica, non potevo non essere attratto dalla bellezza e dall’eleganza delle soluzioni dell’equazione di Schrödinger per l’atomo d’idrogeno. Inspirato dal libro (S. Marseglia, La Chimica col personal computer pubblicato dalla Muzzio) in cui mostrava alcuni esempi di programmi in BASIC per la chimica, decisi di imbarcarmi nell’impresa e usare l’MSX e poi l’Amiga Basic Basic per provare a riprodurre le bellissime visualizzazioni degli orbitali molecolari che vedevo nei libri di chimica universitari. Ma prima di questo vediamo di tornare a contenuto dell’articolo di Schrödinger.

Continue reading

Easter 2025: Exploring Egg-Shaped Billiards

It has become a recurrent habit for me to write a blog on the shape of eggs to wish you a Happy Easter. Not repeating oneself and finding a new interesting topic is a brainstorming exercise of lateral thinking and a systematic search in literature to find an interesting connection. This year, I wanted to explore an idea that has been lurching in my mind for some time for other reasons: billiards.

I used to play snooker from time to time with some old friends. I am a far cry from being even an amateur in the billiard games, but I had a lot of fun verifying the laws of mechanics on a green table. I soon discovered that studying the dynamics of bouncing collision of an ideal cue ball in billiards of different shapes keeps brilliant mathematicians and physicists engaged in recreational academic studies and important theoretical implications.

Continue reading

Look at the Rainbow in a Soap Film: A simple STEM Project

My heart leaps up when I behold 
   A rainbow in the sky:
So was it when my life began; 
So is it now I am a man; 
So be it when I shall grow old, 
   Or let me die!
The Child is father of the Man;
And I could wish my days to be
Bound each to each by natural piety.

William Wordsworth, March 26, 1802


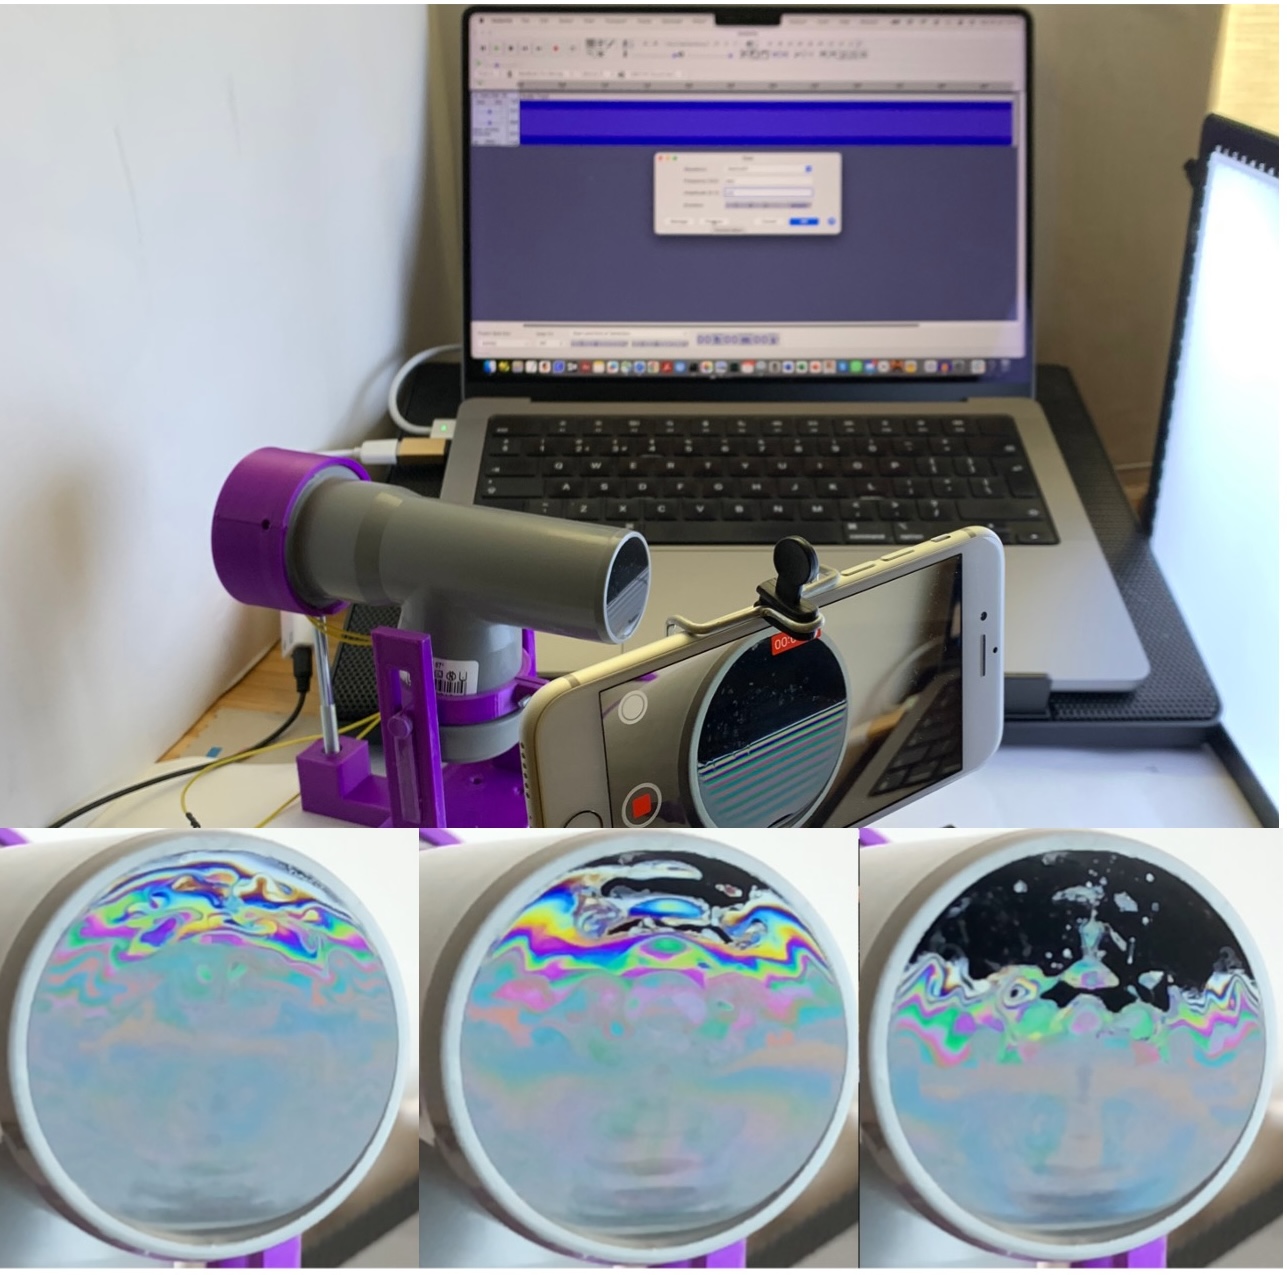
I couldn’t resist citing the beautiful poetry by Wordsworth about the rainbow to introduce my new Instructable, ‘Explore the Physics of Soap Films with the SoapFilmScope.’ I got the idea for this project by reading an article by Gaulon et al. [1]. The authors describe in detail the use of soap film as an educational aid to explore interesting effects in the fluid dynamics of this system. In particular, they examine the impact of acoustic waves on the unique optical properties of the film. In this Instructable, we have designed a device called the SoapFilmScope to perform these experiments. This tutorial will guide you through the process of creating this device, showcasing the mesmerizing interaction between sound waves and liquid membranes. The SoapFilmScope offers an engaging way to explore the physics of acoustics, light interference, and fluid dynamics.

When a sound wave travels through the tube and vibrates the soap film, it creates dynamic patterns through several fascinating mechanisms:

The device consists of a vertical soap film delicately suspended at the end of a tube obtained from a PVC T-shaped fitting that you can get from any DIY store. By attaching a small inexpensive speaker to it, you can let the film dance to the rhythm of the music.

Continue reading

Exploring Photoelasticity of Plastic Materials with the MLT

In the recent Instructable project Introducing the Mini LED Table: Compact, Affordable, and Enhanced With Computer Vision, we presented an inexpensive, compact, and easy-to-build Mini LED Table (MLT) that is a simple and cost-effective project for a STEM activity and a tool for educational purposes. Among other applications, The device can open doors for students and educators to explore the fascinating world of material science and engineering by providing an affordable and compact solution.

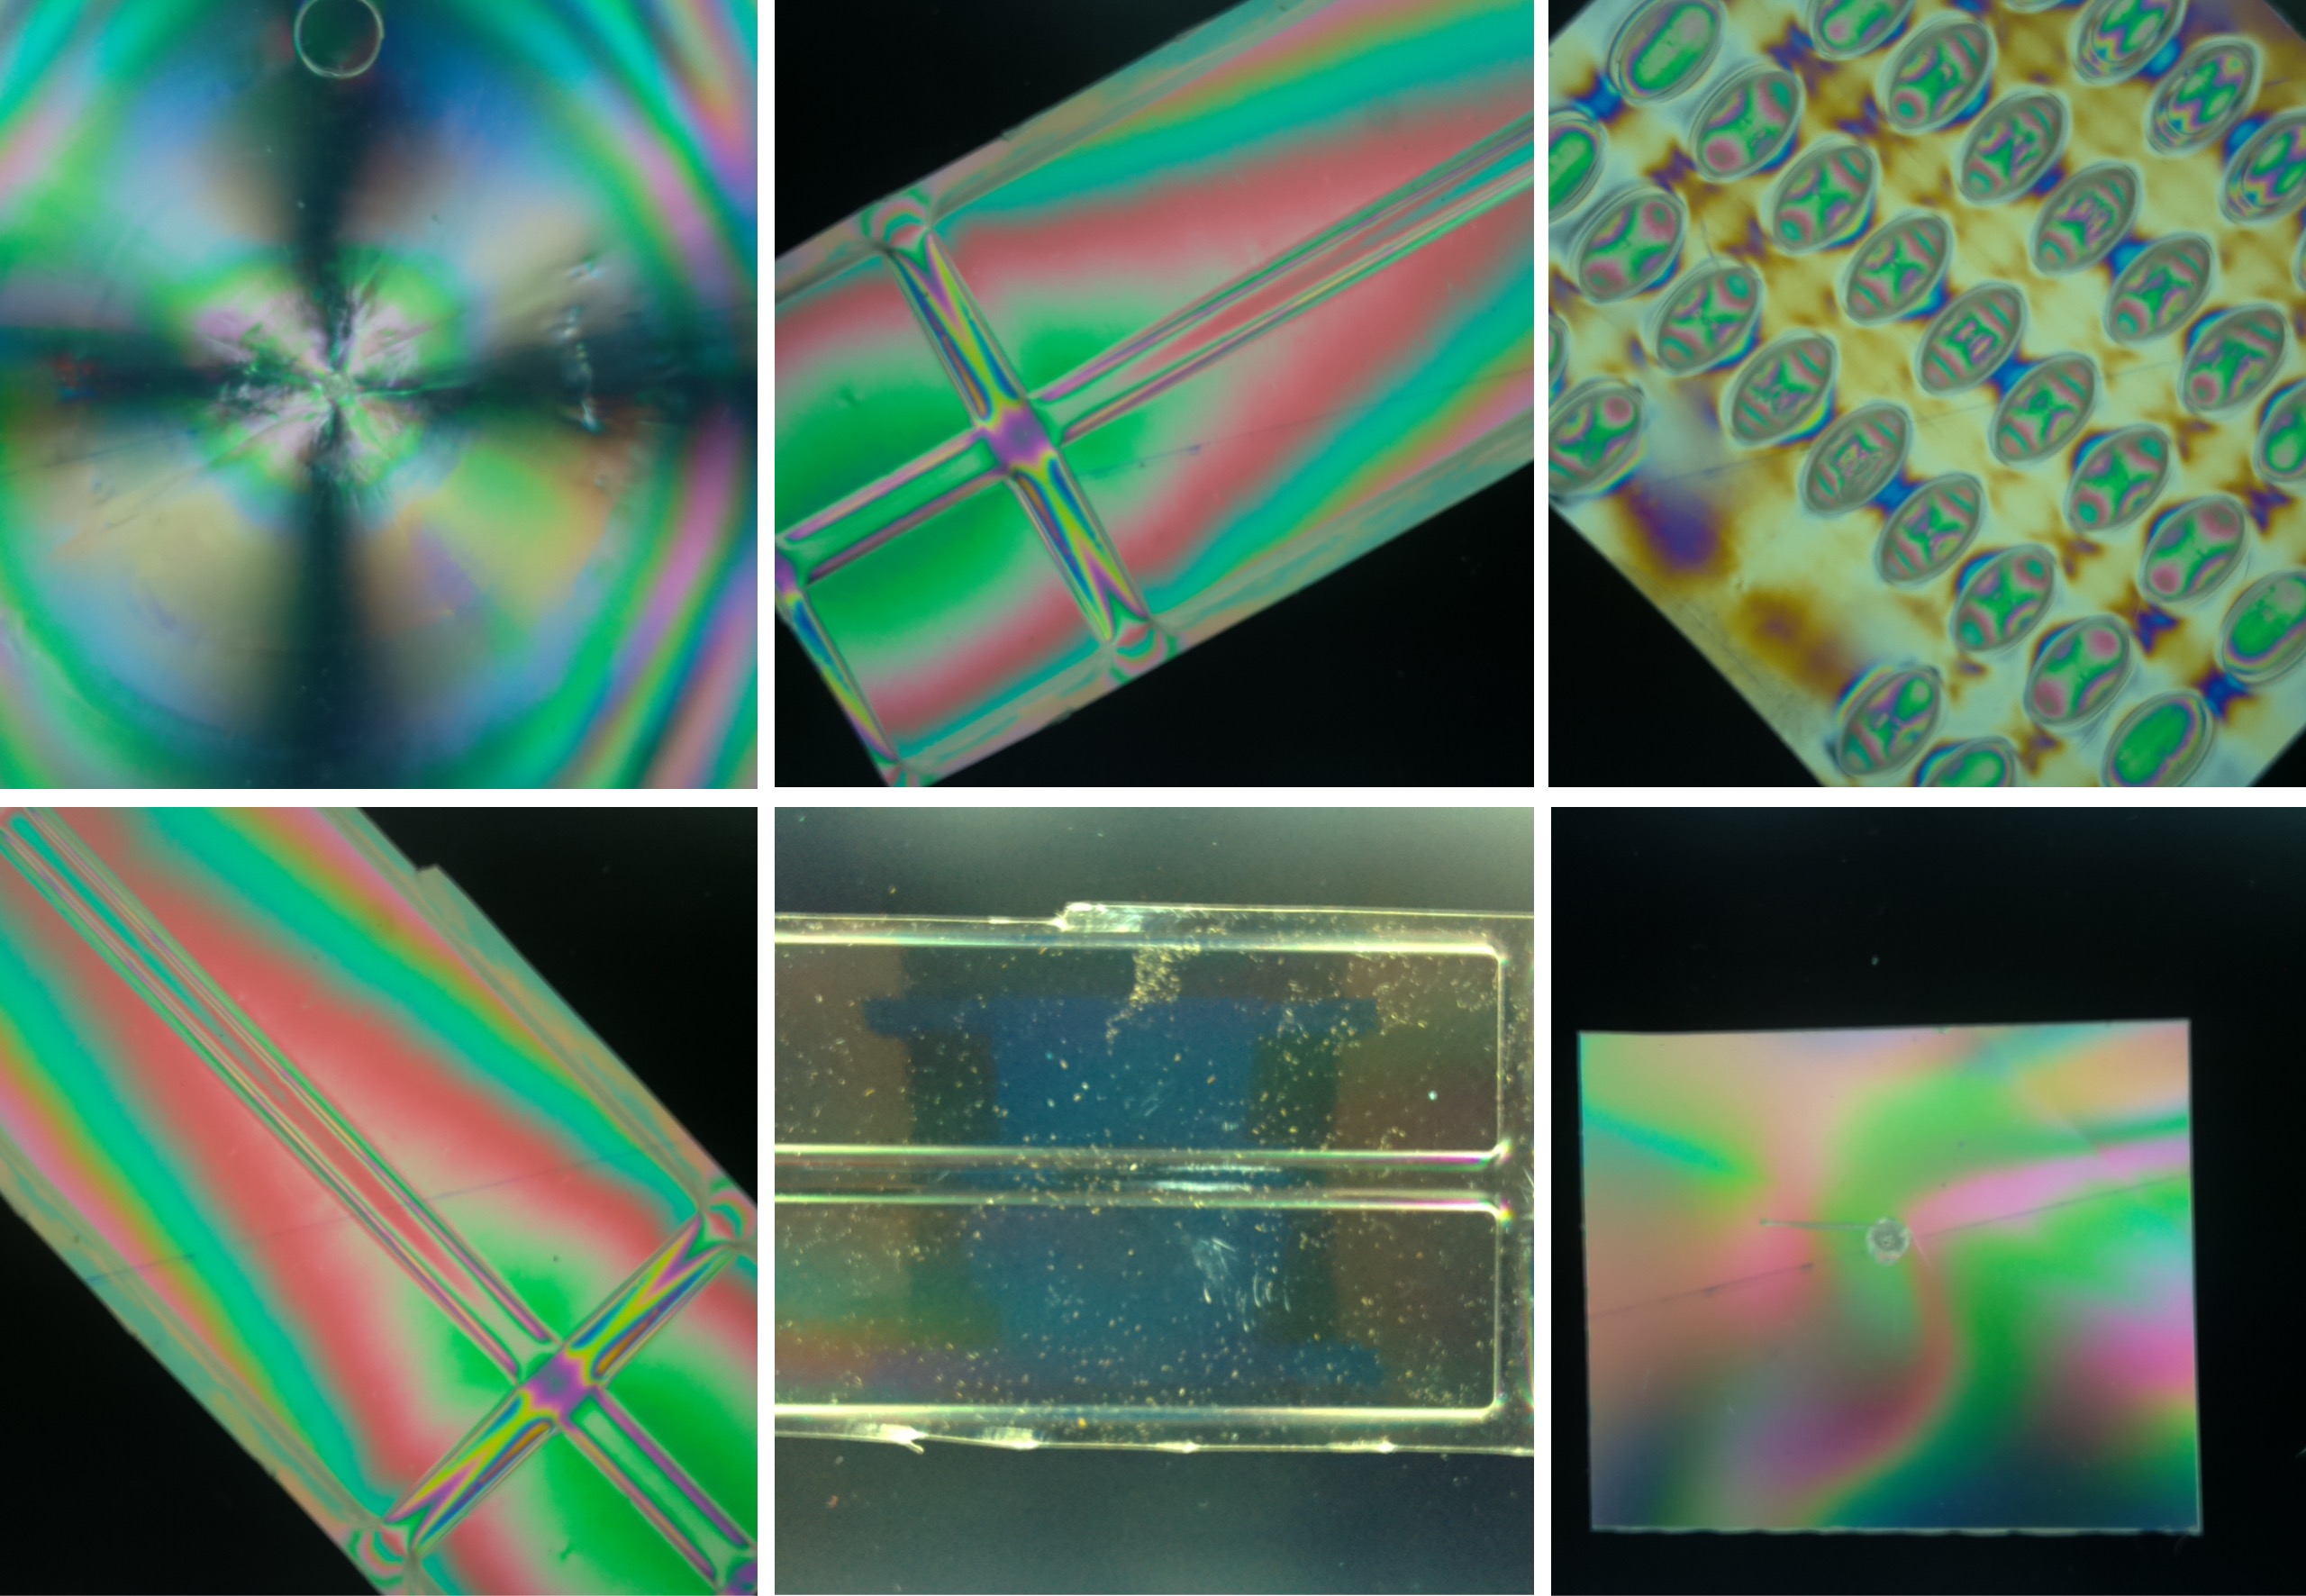
In a new project on the Instructables website, I have extended the capability of the MLT by adding a device that uses polarizer filters in front of the Picamera, which will provide the capability to visualize the internal stress distribution within transparent materials. These stress patterns due to the birefringence of some materials are paramount for engineering analysis. They are significant in determining various substances’ mechanical behavior and structural integrity. 

To address this possible application, we will explain how to add a polarizer to the MLT, which is already equipped with computer vision capabilities. In short, the accessory consists in adding a removable polarizer filter onto the Mini LED Table and incorporating another polarizer near the Picamera mounted on a rotatable 3D support enabling the visualization and analysis of colorful stress patterns that arise in transparent plastic and other materials exhibiting photoelastic effects.

By harnessing the capabilities of MLT, polarized light, and computer vision integration, we want to provide educators and students with a powerful tool for visualizing and understanding the intricate stress patterns present in transparent plastics and other photoelastic materials.

Before delving into the details of the project, let us provide a brief overview of photoelasticity and its significance in engineering. Photoelasticity is a powerful technique used to analyze the stress distribution in materials. It is based on the principle that the refractive index of a photoelastic material changes with applied stress. By passing polarized light through a stressed material and analyzing the resulting fringe patterns, engineers can gain valuable insights into the stress distribution and behavior of the material under various loading conditions.

Photoelasticity finds extensive applications in engineering. It aids in designing and analyzing components subjected to complex stress states, such as structural components, machine parts, and even optical devices. By visualizing stress concentrations, engineers can optimize designs, identify potential failure points, and enhance various systems’ overall reliability and performance. Additionally, photoelasticity plays a crucial role in material testing, prototype validation, and quality control processes, enabling engineers to ensure the integrity and safety of critical components.

Unveiling Stardust on Your Rooftop: a Magnetic Microparticle Sorter and Spotter

With the help of my lovely assistant, we have just published on Instructables another STEM project. This time, it was inspired by the reading of the classic Comets by Carl Sagan and the upcoming period of significant meteor shower events of the year:

  1. Perseids: The Perseids is one of the most popular and reliable meteor showers, occurring annually in mid-August. It is associated with the comet Swift-Tuttle and gets its name from the constellation Perseus, from where the meteors appear to radiate. The Perseids are known for their fast and bright meteors, often leaving long-lasting trails in the sky. They are visible from both hemispheres, but the best viewing opportunities are typically in the northern hemisphere. During its peak, the Perseids can produce up to 60 to 100 meteors per hour.
  2. Geminids: The Geminids meteor shower takes place every December and is considered one of the most reliable and prolific meteor showers of the year. The Geminids are associated with the asteroid 3200 Phaethon and appear to radiate from the constellation Gemini, hence their name. Unlike many other meteor showers, the Geminids can be observed from both the northern and southern hemispheres. They are known for producing bright, colorful meteors and can reach a peak rate of 120 to 160 meteors per hour, making them a spectacular astronomical event.
  3. Quadrantids: The Quadrantids meteor shower occurs annually in early January and is known for its brief but intense display of meteors. The radiant point of the Quadrantids lies in the defunct constellation Quadrans Muralis, which is no longer recognized as a constellation. However, the meteors can be seen anywhere in the sky. The Quadrantids are associated with the asteroid 2003 EH1, which is believed to be an extinct comet. The peak of the Quadrantids is relatively short, usually lasting only a few hours, but it can produce a high meteor rate of around 60 to 200 meteors per hour.

Who won’t be thrilled by capturing a piece of outer space right in your hands? However, you might think, “But I don’t have the necessary equipment!” Fear not, as luck would have it, you’ve stumbled upon this instructable that will guide you in creating your own Micrometeorite Separator and Spotter (MSS).

Sure, it’s true that if a magnificent carbonaceous chondrite were to gracefully land right in front of your doorstep, you wouldn’t need any equipment. However, chances are high that tiny fragments of meteorites, resembling specks of falling stars, are scattered on your rooftop, waiting to be discovered. Countless websites and YouTube videos share fascinating tales of those who have embarked on this labor of love, showcasing the patience and dedication required to uncover these elusive cosmic treasures. The meteorites you’re after are microscopic, so your search will focus on distinguishing them from the terrestrial dust and debris that pervade our surroundings.

Fortunately, a small and mighty Neodymium magnet proves invaluable in this pursuit, especially for isolating metallic meteorites. Yet, be prepared for a challenging quest, as finding these little celestial gems is no easy task. However, the rewards of discovering even a single meteorite are genuinely remarkable.

We have recently published an Instructable project presenting a simple yet effective device to aid you in your meteorite discovery journey. This device remains compact and portable that can be used with a digital microscope or fitted under a stereomicroscope and the wonders they reveal.

So, get ready to embark on an extraordinary adventure and immerse yourself in the captivating world of meteorite hunting. With the Micrometeorite Separator and Spotter (MSS) at your disposal, you’ll be equipped to explore the heavens and unveil the hidden secrets within the depths of our vast universe.

Happy hunting, and do not forget to like this post and the Instructable !