"… I seem […] only like a boy playing on the sea-shore, and diverting myself in now and then finding a smoother pebble or a prettier shell than ordinary, whilst the great ocean of truth lay all undiscovered before me". – Isaac Newton.
Just a few days ago, I was lucky enough to witness, with my own eyes (safely protected by a proper solar filter!), one of the most fascinating astronomical events visible from Earth: a solar eclipse. Eclipses are not particularly rare on a global scale, but their visibility strongly depends on geographical location. The path of a total solar eclipse covers only a relatively narrow region of the Earth’s surface, meaning that totality may return to the same location only after a very long interval. Solar eclipses have fascinated humans for thousands of years and are among the astronomical phenomena most extensively recorded by ancient civilizations. Historical observations from Babylon, China, Europe, and the Arab world are so valuable that they have even been used to investigate changes in the Earth’s rotation over the past several thousand years.
On 12 August 2026, a total solar eclipse crossed parts of the Northern Hemisphere. From the UK, where I currently live, totality was not visible, but a substantial partial eclipse could still be observed. Having a basic refractor telescope and a good observation point, I decided to try recording the entire event as a time-lapse. I invested in a suitable solar filter for my Bresser Arcturus 60/700 mm telescope. The telescope has no automatic tracking, so this meant manually following the Sun throughout the roughly two-hour event. Afterwards, I planned to use Python, computer vision, and ChatGPT to align and filter the recorded frames and reconstruct a smooth eclipse sequence.
But my interest in this event was not limited to photographic observation. I was also curious to extract quantitative information from the recorded frames and to investigate what was happening to the environment while the Moon progressively obscured the Sun. Changes in incoming solar radiation should affect quantities such as light intensity, UV radiation, and, potentially, temperature and humidity. I already had several Arduino boards and a collection of inexpensive sensors at home, so this seemed like a perfect opportunity to turn the eclipse observation into a broader experiment. The question behind the project therefore became: Could a simple telescope, a few low-cost sensors, and some Python code reveal not only the progress of a solar eclipse, but also how the environment responds to it? The answer was YES: it is possible, and it was pretty simple to set it up!
I have published an article on my Instructables website in which I outline the setup of my Environmental Solar Station (ESS), show what I measured during the eclipse, and suggest ideas for future development. In this post, I will instead give some information about the creation of the video on the YouTube channel embedded below.
Alatri is a picturesque town in the province of Frosinone approximately 80 km southeast of Rome. Located in the heart of Ciociaria, it overlooks the Sacco Valley from a hilltop position. Among its many attractions, the historic centre preserves one of the best-preserved examples of megalithic architecture in the region. Megalithic architecture is characterized by the use of massive stone blocks, often referred to as megalithic or Cyclopean masonry. In Alatri, this tradition is represented by the impressive polygonal walls that surround the acropolis, the highest part of the town. These walls were constructed for defensive purposes and may also have served religious or ceremonial functions. Similar megalithic structures can be found throughout Europe, from Greece to the British Isles, as well as in several regions of Italy. Alatri is one of the most notable megalithic towns of Ciociaria, while other remarkable examples of polygonal masonry can be seen in the nearby towns of Ferentino and Veroli.
I will write more about megalithic architecture in another article. In this context, I will describe a more recent but still beautiful architectural embellishment. This embellishment has a practical function. It is prominently visible in the Piazza Santa Maria Maggiore, the town’s central square. I am referring to the beautiful sundial (OROLOGIO SOLARE in italiano, see photo below). It was built in 1867 on the facade of the Palazzo Conti Gentili. The architect Giuseppe Olivieri constructed it based on accurate calculations by Padre Angelo Secchi. He was a renowned Jesuit and astronomer. A photo of the sundial is reported below. In Italian, the sundial is translated as orologio solare, as written in the image.
Figure 1: Photo of the Secchi’s sundial located in Piazza Santa Maria Maggiore of Alatri.
The analysis of this sundial gave me the opportunity to introduce the principles used to build it. I also learned a bit more about astronomical calculations. Therefore, I want to share with the reader my findings.
What is a sundial?
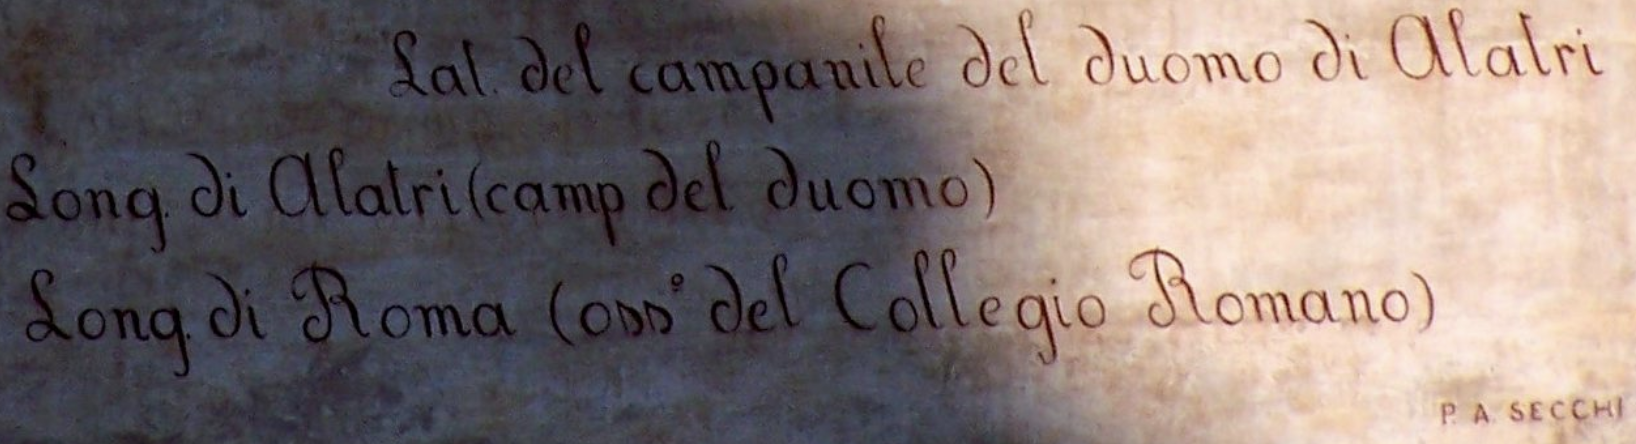
The sundial (also called meridian) is a time-measuring device based on the regular rotation of the Earth. The Sun’s apparent position in the sky changes the shadow’s projection cast by the dial. This shadow falls on a surface that has been time marked. As a result, the surface can have different orientations and shapes. The Secchi’s sundial is a vertical type with orientation North-South. The title on the top states this: The Secchi’s sundial shows the real time. It also shows the average time (OROLOGIO SOLARE A TEMPO VERO E MEDIO). The calligraphic text on the bottom indicates the geographic coordinates of the sundial.
The latitude and longitude indicate the location of the bell tower. It is part of the cathedral of Alatri (duomo di Alatri o Basilica di San Paolo). As reference meridian (the prime meridian) was consider the one passing for the city of Rome. In particular, it is the meridian that passes through the Collegio Romano observatory. Secchi was the director there at the time of the sundial’s construction. The international adoption of the prime meridian passing through London was agreed upon during an international geographic conference. This conference was organized in the same city in October 1884. Before this date, country were used to adopt their own prime meridian, usually passing for the capital. So it is not surprising that Sacchi used as reference meridian the one passing for Rome. The Colleggio Romano was a school established by founder of the Society of Jesus St. Ignatius of Loyola in 1551. It is located in the Piazza del Collegio Romano in the Pigna District. P.A. Secchi was the director of the astronomic observatory of the school. The Monte Mario Observatory was constructed in 1934, at Villa Mellini. This moved the prime meridian for Rome there. It was used as the reference meridian for Italy’s geographic maps until 1960.
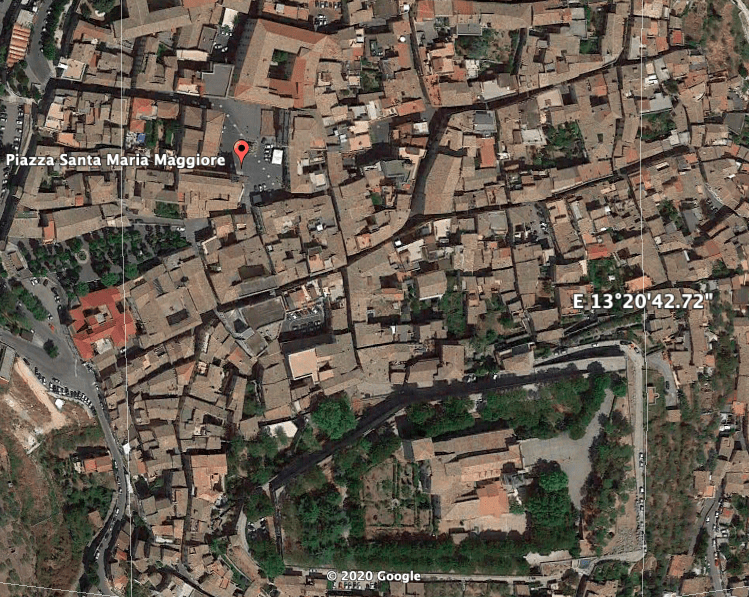
The geographic coordinates of the cathedral of Alatri given by Google Maps are 41.7248° N, 13.3443° E. Therefore, Sacchi approximated the longitude to the one of the Collegio Romano (41.8988° N, 12.4807° E) that he could accurately calculate. According to Google Earth, the sundial’s position is 41°43′ 35.86″ N, 13° 20′ 33.86″ E. Therefore, the prime meridian is used to calculate the real-time of the sundial.
Figure 2: Position of the Piazza Santa Maria Maggiore and of the cathedral of Alatri (bottom complex). Source Google Earth.
The length of the shadow cast by the sundial varies with the Sun’s altitude, and it also changes during the year as the Earth moves along an orbit that is inclined by ~23.4° concerning the ecliptic plane (the position of the Sun’s equator). The length defines a particular position for the Earth in its orbit, as the solstices and equinoxes are the dates in between. The length of the shadow is marked on the solar clock with seven declination arcs. The latter ones go from left to right, delimited by the Zodiac signs and solstices, and equinoctial dates. Using the Zodiac sign is a convenient way to divide into 12 sectors of 30° the ecliptic longitude along the Earth’s orbit. This leads to 7 arcs, five crossed twice by the Sun (when its declination is increasing and decreasing), plus two for solstices (extreme declinations). As Sun’s altitude varies between +/- 23° 26′, it is also possible to draw arcs every 5° of declination, with the equinoctial line (March 21st and September 22nd) in the middle which corresponds to 0° of declination (Sun on the equator).
Description of the Components of the Sundial
The Secchi’s sundial in Alatri consists of several key components that contribute to its functionality and accuracy in measuring time. These components include the gnomon, the dial plate, the hour lines, and the declination arcs. The dial plate serves as the surface upon which the shadow of the gnomon falls. It is typically a flat, horizontal surface with markings or engravings that denote the hours of the day. In the case of this sundial, the dial plate features hour lines and declination arcs that aid in reading the time and understanding the position of the Sun.
Gnomon: The gnomon is a crucial element of the sundial, responsible for casting the shadow that indicates the time. In the case of the Secchi’s sundial, the gnomon is a vertical structure aligned in a North-South direction. It is designed to be perpendicular to the dial plate and is carefully positioned to ensure the accuracy of the shadow projection.
Hour Lines: The hour lines on a vertical sundial represent the hours of the day and are usually spaced evenly on the dial plate. To determine the position of the hour lines, we consider the angle between the gnomon and the noon line (the line pointing directly towards the Sun at solar noon). Let’s denote this angle as θ. Assuming that the gnomon is aligned perfectly North-South, the angle θ can be calculated using the latitude of the sundial’s location (represented by φ). The equation is as follows: Once we have the angle , we can divide it by (since there are 15 degrees of longitude per hour) to determine the angular distance between each hour line.This angular distance can then be translated into linear distances on the dial plate based on the specific design of the sundial. In Secchi’s sundial, the lines are indicated with Roman numerals from left to right as X, XI, XII, I, II, III, IV, respectively.
Declination Arcs: The sundial incorporates declination arcs, which are curved lines that represent the lengths of the shadow at specific times of the year. In the case of the Secchi’s sundial, there are seven declination arcs. These arcs are marked by the signs of the Zodiac and the solstices and equinoxes. The declination arcs provide additional reference points for understanding the position of the Sun and the corresponding time. The declination arcs on the sundial represent the lengths of the shadow cast by the gnomon at specific times of the year. The position of these arcs can be determined using the latitude of the sundial’s location and the declination of the Sun at various points throughout the year. The declination (represented by δ) is the angular distance between the Sun and the celestial equator. It varies throughout the year due to the tilt of the Earth’s axis. The formula for calculating the declination at a given day of the year is complex and involves astronomical calculations, but it can be approximated using simpler methods. Using the simplified approximation, we can calculate the declination (δ) based on the day number (represented by n, with n=1 being January 1st). The equation is as follows: With the declination (\delta) determined, we can mark the corresponding declination arc on the sundial. The length of the arc will depend on the specific design and scale of the sundial.
Analemmas: The analemmas on a sundial are curves that represent the changing position of the Sun in the sky throughout the year. The shape of the analemma is influenced by the combined effect of the Earth’s elliptical orbit and axial tilt. The equation of time is directly related to the shape and position of the analemmas. The equation of time is a mathematical expression that represents the difference between solar time (based on the Sun’s actual position in the sky) and mean solar time (based on a uniform 24-hour day). This difference arises from two main factors: the Earth’s elliptical orbit and its axial tilt. The equation of time (EoT) is given as a function of the day of the year (n) and is typically measured in minutes. It can be positive or negative, indicating whether solar time is ahead or behind mean solar time, respectively. The equation of time affects the position of the Sun in the sky and, consequently, the position of the hour lines and analemmas on a sundial. The analemmas help to correct the discrepancy between solar time and mean solar time by providing reference points on the sundial.
By combining the gnomon, the dial plate with hour lines, and the declination arcs, the Secchi’s sundial allows for the accurate measurement of time-based on the position and length of the shadow cast by the gnomon. Observers can align the shadow with the hour lines to determine the time of day. At the same time, the declination arcs provide insights into the Sun’s position along the ecliptic throughout the year.
It is worth noting that the accuracy of the sundial’s measurements can be influenced by factors such as the precise alignment of the gnomon, the dial plate’s orientation, and the location’s latitude. However, the design of the Secchi’s sundial, with its North-South alignment and inclusion of declination arcs, enhances its accuracy and usefulness as a time-measuring device in Alatri.



 Once we have the angle
  , we can divide it by
  (since there are 15 degrees of longitude per hour) to determine the angular distance between each hour line.This angular distance can then be translated into linear distances on the dial plate based on the specific design of the sundial. In Secchi’s sundial, the lines are indicated with Roman numerals from left to right as X, XI, XII, I, II, III, IV, respectively.
 With the declination (\delta) determined, we can mark the corresponding declination arc on the sundial. The length of the arc will depend on the specific design and scale of the sundial.

