Mutagenesis Assistant Program (MAP) is a free accessible statistical tool which can be used for the benchmarking of random mutagenesis methods on the protein level.
The server in the last version is described in the following publications:
- Verma, U. Schwaneberg, D. Roccatano. MAP2.03D: A Sequence/Structure-Based Server for Protein Engineering. ACS Synthetic Biology. 1(4), 139, (2012).
- Verma, U. Schwaneberg, D. Roccatano.The Mutagenesis Assistant Program. In Methods in Molecular Biology. E. Gillam, D. Ackerley and J. Copp Eds., Springer Protocols, Humana Press (2014).
- S. Wong, D. Roccatano, M. Zacharias, U. Schwaneberg. A statistical analysis of current random mutagenesis methods for directed protein evolution.J. Mol. Biol., 355, 858-871 (2006). COVER PAGE.
In this blog, the main aspects of the server are summarized. The development of the server started in 2005, at the time I was working at the International University of Bremen (Germnay). I started to collaborate with Prof. Ulrich Schwaneberg (now at the RWTH Aachen, Germany) and, at the time, his Ph.D. student, Dr. Tuck Seng Wong (now a senior lecturer at the University of Sheffield, UK), studying enzyme in organic solvent and as our collaboration proceed, I also started to be intrigued by the experimental method of the directed evolution used to improve the performances of the proteins. The methods exploit in a smart way what Nature is doing for billions of years to all living organisms on Earth: evolving. Using these methods, proteins can be optimized (engineered) to improve their performances. Bacteria are the factories used for his process as they can reproduce in the short time of a coffee break. You provide to the factory the blueprint of your idea in form of DNA gene and they will produce the protein nanomachine in the amount that you need, in this generation, you can tweak on their production machinery using random mutagenesis methods to let them make some errors in the structure of the nanomachines that affect hopefully increasing their performances. The next step is to design a way to select only the bacteria mutants that contains the optimized version of the nanomachine that can be selected and undergoes other rounds of mutation to further improve the protein.
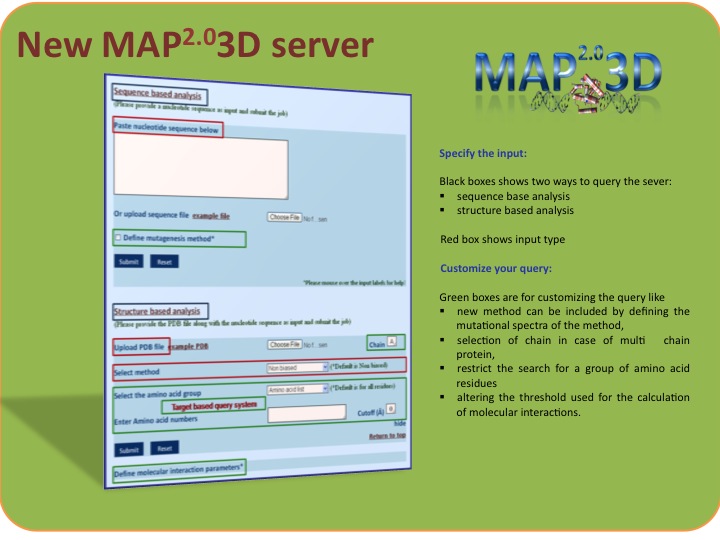
The random mutagenesis methods have different mutational spectra and mutational frequency and differently affected by the redundancy of genetic code. Mutational spectrum is a set of data that include the frequency of mutations in a target nucleotides sequence under defined conditions. Generally, transition/transversion bias indicator is used to access the mutational spectra of any random mutagenesis method. The transition/transversion bias indicator provides the information on gene level which is insufficient for protein engineer to develop a directed evolution strategy because it is important to know which amino acid substitution can be generated on protein level for example at a position which is functionally important. MAP program provides two ways for the comprehensive analysis of random mutagenesis methods on the level of amino acid substitution:
- Sequence-based analysis,
- Structure-based analysis.
SEQUENCE-BASED ANALYSIS
It is performed upon nucleotide sequence as input on amino acid substitution level and the result is provided by three novel indicators based on the subset of amino acid substitution generated on the protein level:
a) Protein structure indicator
It measures the fraction of protein structure/function-disrupting (stop codons) and likely destabilizing amino acid substitutions (Gly and Pro residues).
- The fraction of variants with stop codons: Fraction of single nucleotide substitutions resulting in a stop codon (TAA, TGA or TAG).
- The fraction of variants with Gly or Pro: Fraction of single nucleotide substitutions resulting in a glycine or proline codon (GGA, GGT, GGG, GGC, CCA, CCT, CCG or CCC).
EXAMPLE
This example is based on the gene of the enzyme phytase (EMBL-Bank: AY496073.1). The structure/function disrupting (stop codons) and likely destabilizing (glycine and proline residues) amino acid substitutions. Bar colors show the mutagenesis method employed for nucleotide substitution: enzyme-based methods in red, whole cell methods in green, synthetic chemistry-based methods in blue and theoretical nonbiased method in black color.
b) Amino acid diversity indicator
It is measured by the fraction of variants with preserved amino acids and the average number of amino acid substitution per residue.
- The fraction of variants with preserved amino acids: Fraction of single nucleotide substitutions that do not change the encoded amino acid.
- Average amino acid substitution per residue: Average number of amino acid substitutions after single nucleotide exchange of a codon.
EXAMPLE
This example is based on the gene of the enzyme phytase (EMBL-Bank: AY496073.1). The fraction of variants with preserved amino acids and average amino acid substitution per residue after single nucleotide exchange. Bar colors show the mutagenesis method employed for nucleotide substitution: enzyme-based methods in red, whole cell methods in green, synthetic chemistry-based methods in blue and theoretical nonbiased method in black color.

c) Codon diversity coefficient
It is a coefficient that measures how random mutations are distributed among codons of a gene. In a method with non-biased mutational spectra (equal occurrence of A-N, T-N, G-N, and C-N), the Codon diversity coefficient has a value of 0. Biased methods show preferences toward certain nucleotide exchanges and mutate certain nucleotides in codons preferentially. In other words, biased mutagenesis methods generate “hot-spots” for mutagenesis that compromises genetic diversity.
d) Chemical diversity indicator
It analyzes how chemically different the substituted amino acids are. For chemical diversity indicator, amino acids are grouped into four categories depending on chemical properties of amino acids. An ideal mutagenesis method allows us to substitute each residue equally with 19 other amino acids at each amino acid positions.
- Chemically categorized amino acid substitution graph: Shows the percentages of aliphatic, aromatic, neutral and charged amino acid substitutions generated by all 19 random mutagenesis methods
- Chemically categorized amino acid substitution values: Data are reported as the deviation of each random mutagenesis method from the ideal chemical distribution described above.
- Amino acid substitution patterns (matrix): Analyze to which extent each amino acid species is generated. These figures show the substitution pattern for each of the 20 amino acids in the protein of interest of all 19 random mutagenesis methods. Y-axis and X-axis represent 20 amino acid species in the protein of interest and amino acid substitution pattern generated respectively.
EXAMPLE
This example is based on the gene of the enzyme phytase (EMBL-Bank: AY496073.1). Codon diversity coefficient shows the distribution of random mutations among codons of a gene for mutagenesis methods (enzyme-based methods in red, whole cell methods in green, synthetic chemistry-based methods in blue and theoretical nonbiased method in black color). Chemical diversity indicator shows the percentages of the stop codon (red), charged (pink), neutral (yellow), aromatic (cyan) and aliphatic (blue) amino acid substitutions generated by random mutagenesis methods.
More examples can be found in the original papers cited in the bibliography.
STRUCTURE-BASED ANALYSIS
The structure-based analysis is the most recent improvement of the servers. This development was part of the EU 7 framework project “OXYZYME: Effective Re-Design of Oxidative Enzymes for Green Chemistry“. The grant supported the Ph.D. of Dr. Rajni Verma (now at the Univ. of Wichita, USA) and the development of the MAP2.03D server was a part of her Ph.D. thesis. The new server MAP2.03D can now perform upon a selected random mutagenesis method at a time and requires a crystallographic structure or reliable homology model of the protein along with the nucleotide sequence as input.
Along with the basic MAP indicators, it provides the informatics of the factors related to the protein stability, flexibility, and activity with mutational spectra by correlating it with the local structure environment of the protein and the molecular interactions of its residues:
a) Local structure environment
The local structural environment of the protein comprises secondary structure element, residue flexibility, and solvent accessibility
- Secondary structure assessment: Secondary structure assignments are important to assure the optimal yield of experimental structures and to cleverly select the target for mutagenesis. We provide the secondary structure information by using DSSP program. Each residue is assigned to one of the four states:
- H: alpha helix,
- B: beta bridge and extended strand,
- T: hydrogen bonded turn and bend,
- *: loop or irregular structures.
- Residue flexibility: Proteins are dynamic molecules that are in constant motion, which enabled structural flexibility associated with various biological processes like molecular recognition and catalytic activity. Crystallographic B-factors (obtained from the crystallographic structure of the protein) is used as a representative of residue flexibility. The relative B-factor value of backbone atoms is used to differentiate flexible regions of protein from rigid.
- Relative solvent accessibility: consequently, the solvent-inaccessible residues have a lower rate of acceptance of mutations than those on the surface and it has been used to estimate protein stability together with residue flexibility. Relative solvent accessibility (RSA) is used to differentiate between exposed and buried residues. RSA is calculated by the ratio of the number of water molecules in contact with residue/total surface area of the residue. A threshold is used to differentiate between exposed (RSA>=0.16) or buried residues (RSA<0.16) by using RSA.
b) Molecular interactions
Intra residue interaction plays an important part in protein folding, stability, and function. The knowledge of molecular interaction helps to evaluate the effect of amino acid substitutions in the stability or activity of the protein.
- Salt bridges: They are relatively weak ionic bonds between oppositely charged residues in protein structures. The script is used by the server to define salt bridges if the charged-group atoms in the residues are found to be laid within the distance of 2.0 to 4.0 Å in the structure.
- Hydrophobic interactions: If the distance between the hydrophobic chains of non-polar amino acids, is within 5 Å, it was considered to be involved in a hydrophobic interaction. We used the same criteria for the definition of hydrophobic interactions by using a Perl script at the backend in our server.
- Aromatic interactions: If the aromatic residues are found to be separated by a preferential distance of between 4.5 to 7.0 Å, is considered to be involved in an aromatic interaction.
- Side-chain hydrogen bonds: The hydrogen bond formation was defined on the criterion of a donor-acceptor distance within 3.5 Å (oxygen and nitrogen) and 4.0 Å (sulfur), angular criteria are not considered during calculation of side chain to side chain and side chain to main chain hydrogen bonds in MAP analysis.
- Disulfide bonds: These are the covalent bonds derived from the coupling of thiol group on cysteines and calculated by DSSP program.
REFERENCES
- Verma, U. Schwaneberg, D. Roccatano.The Mutagenesis Assistant Program. Methods in Molecular Biology. E. Gillam, D. Ackerley and J. Copp Eds., Springer Protocols, Humana Press (2014).
- Verma, U. Schwaneberg, D. Roccatano. MAP2.03D: A Sequence/Structure-Based Server for Protein Engineering. ACS Synthetic Biology. 1(4), 139, (2012).
- Verma, U. Schwaneberg, D. Roccatano. Computer-aided directed protein evolution: a review of servers, database, and tools for protein engineering. Computational and Structural Biotechnology Journal. 2(3), e201209008, (2012).
- S. Wong, D. Roccatano, M. Zacharias, U. Schwaneberg. A statistical analysis of current random mutagenesis methods for directed protein evolution.J. Mol. Biol., 355, 858-871 (2006). COVER PAGE.
- Schenk, T. S. Wong, D. Roccatano, B. Hauer, U. Schwaneberg. SeSaM (Sequence Saturation Mutagenesis): Eine Methode zur Sättigungsmutagenese eines Genes. Biospectrum, 3, 277-279(2006).
- S. Wong, D. Roccatano, U. Schwaneberg. Steering directed protein evolution: strategies to manage combinatorial complexity of mutant libraries., Environmental Microbiology, 9(11), 2645-2659, (2007).
- S. Wong, D. Roccatano, U. Schwaneberg. Challenges of the genetic code for exploring sequence space in directed protein evolution. Biocatalysis and Biotransformation, 25(2-4), 229-241, (2007).
- S. Wong, Danilo Roccatano, U. Schwaneberg. Are transversion mutations better? A MAP-analysis on P450 BM-3 heme domain Biotechnology Journal, 2, 133-142 (2007).
- S. Wong, D. Roccatano, K. L. Tee, A. Schrenk, M. Breuer, B. Hauer, U. Schwaneberg. Transversion-enriched sequence saturation mutagenesis (SeSaM-Tv+): A random mutagenesis method with consecutive nucleotide exchanges that complements the bias of error-prone PCR. Biotechnology Journal, 3(1), 74-82, (2008).

